Fig. A.1
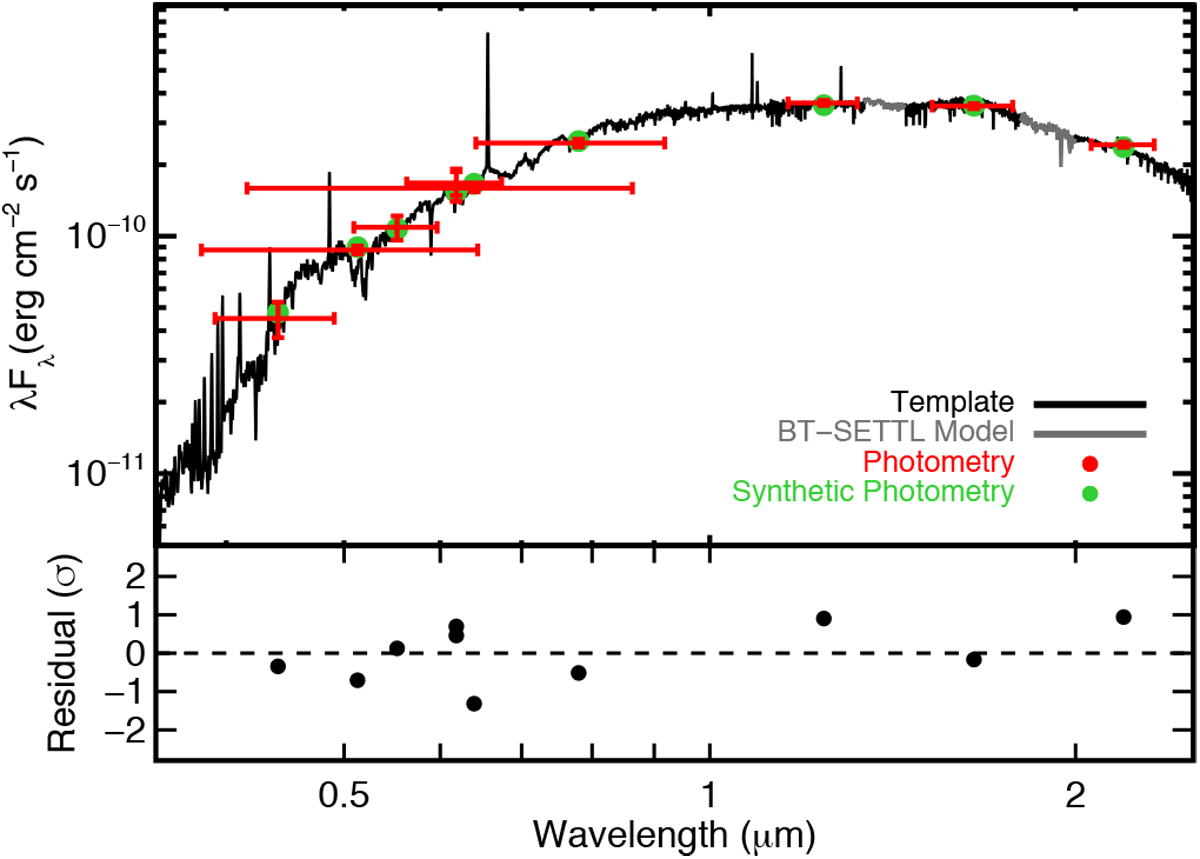
Best-fit spectral-energy distribution for J1610 created by generating synthetic photometry (green) from our observed spectra (black) and model atmosphere (grey) and locking it to the literature photometry (red). Vertical error bars on the observed photometry correspond to uncertainties (include an estimate of the stellar variability) and horizontal errors represent the width of the filter profile. Bottom panel: residual photometry in units of standard deviations. We de-redden the calibrated spectrum before computing the bolometric flux, but the spectrum and photometry shown here are still reddened.
Current usage metrics show cumulative count of Article Views (full-text article views including HTML views, PDF and ePub downloads, according to the available data) and Abstracts Views on Vision4Press platform.
Data correspond to usage on the plateform after 2015. The current usage metrics is available 48-96 hours after online publication and is updated daily on week days.
Initial download of the metrics may take a while.