Fig. 7
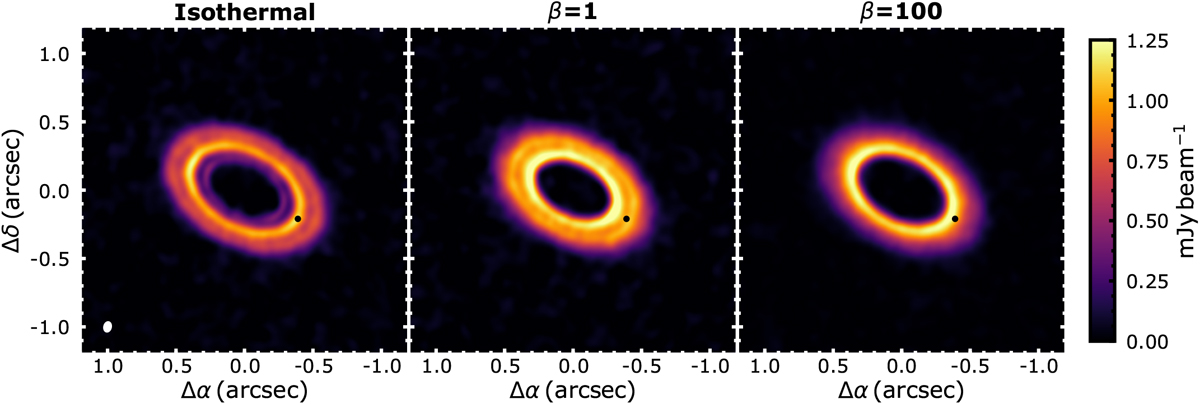
Simulated continuum images based on (left) isothermal, (middle) β = 1, and (right) β = 100 models. The location of the planet (−0.39″, −0.21″) is shown with a black filled circle in each panel. The synthesized beam is shown with a white ellipse in the lower-left corner of the left panel. We note the diverse continuum morphology that various treatments of the disk thermodynamics can produce.
Current usage metrics show cumulative count of Article Views (full-text article views including HTML views, PDF and ePub downloads, according to the available data) and Abstracts Views on Vision4Press platform.
Data correspond to usage on the plateform after 2015. The current usage metrics is available 48-96 hours after online publication and is updated daily on week days.
Initial download of the metrics may take a while.