Fig. 4
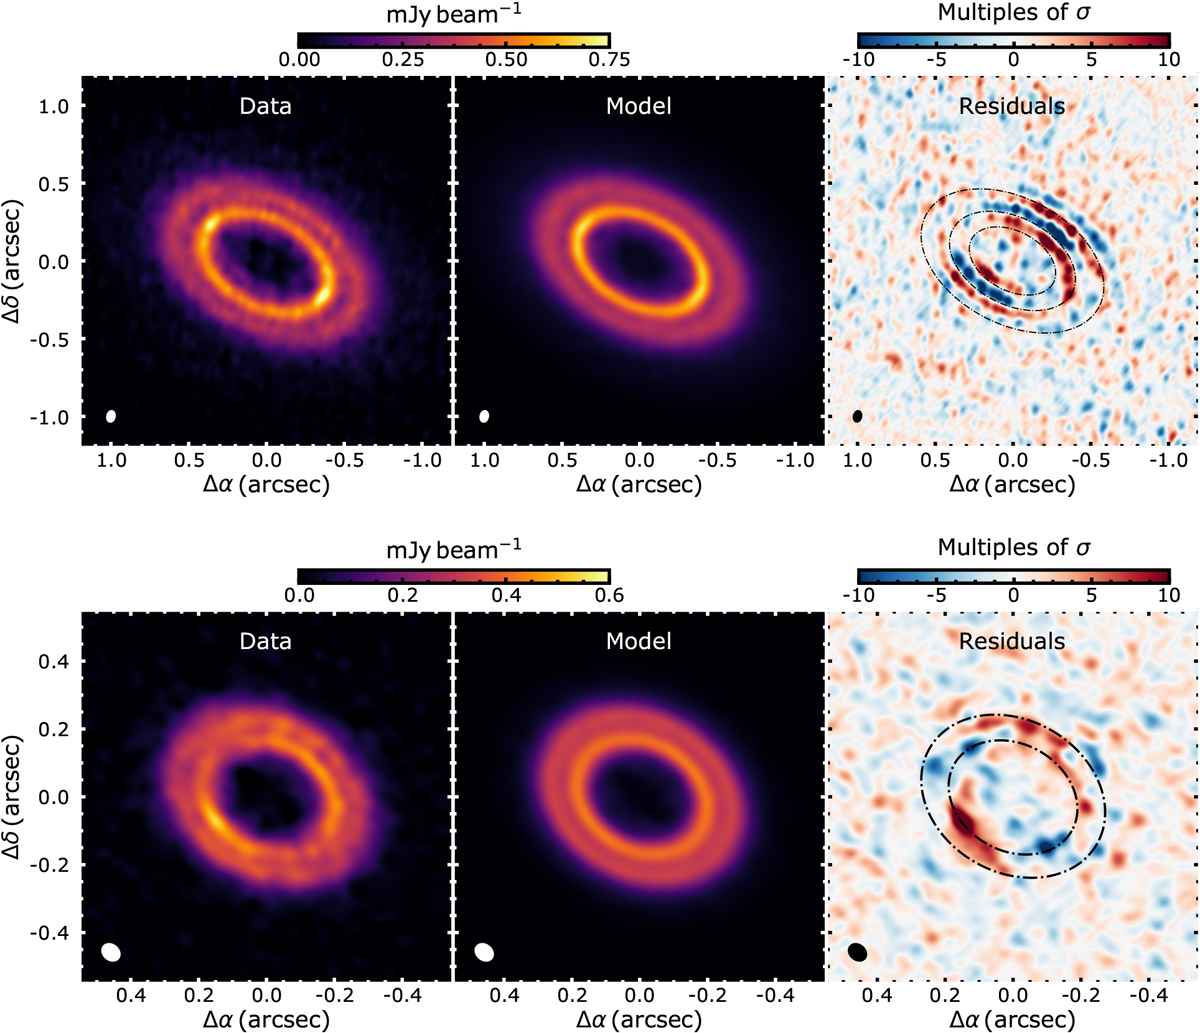
From left to right: intensity map of the data, best fit model, and residual visibilities for LkCa 15 (top) and J1610 (bottom). The intensity map of the best fit model and residuals have been generated using the same uv-sampling as the original data. In the residual map, the black dashed-dotted lines show the location of the rings (see Tables 2 and 3).
Current usage metrics show cumulative count of Article Views (full-text article views including HTML views, PDF and ePub downloads, according to the available data) and Abstracts Views on Vision4Press platform.
Data correspond to usage on the plateform after 2015. The current usage metrics is available 48-96 hours after online publication and is updated daily on week days.
Initial download of the metrics may take a while.