Fig. 3
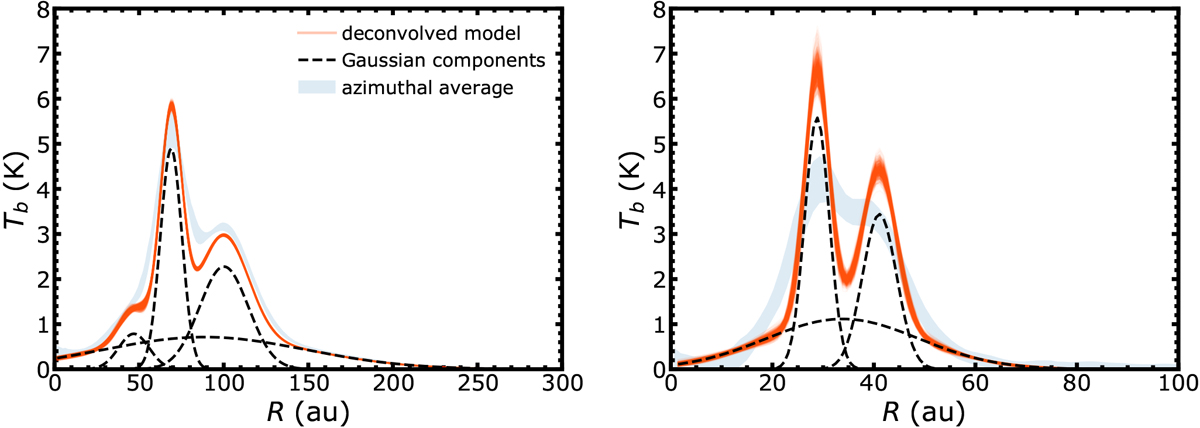
Deconvolved brightness temperature radial profiles of LkCa 15 (left panel) and J1610 (right panel), calculated in the Rayleigh-Jeans approximation (see Sect. 3.2). The red curves show 800 random realizations of the posterior distribution of the GALARIO model, while the dashed black lines indicate the best fit of the Gaussian componentsused in the model. The underlying blue shaded region shows the deprojected and azimuthally averaged brightness temperature profile derived from Fig. 1 (see Sect. 3.1).
Current usage metrics show cumulative count of Article Views (full-text article views including HTML views, PDF and ePub downloads, according to the available data) and Abstracts Views on Vision4Press platform.
Data correspond to usage on the plateform after 2015. The current usage metrics is available 48-96 hours after online publication and is updated daily on week days.
Initial download of the metrics may take a while.