Fig. 2
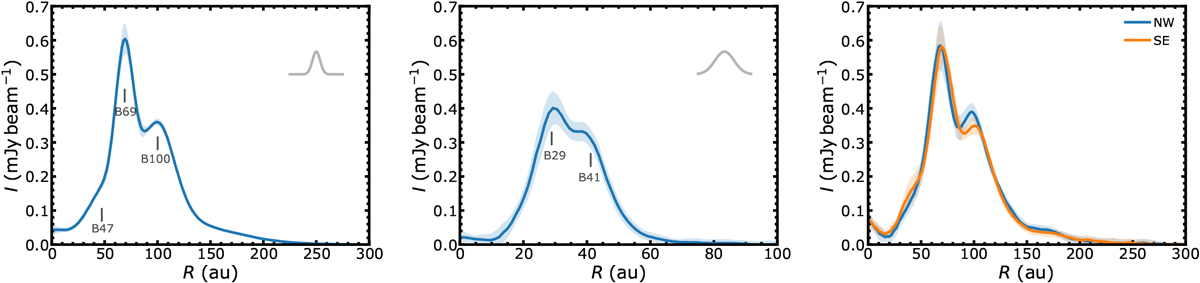
Left and middle: deprojected and azimuthally averaged radial intensity profile of the continuum emission of LkCa 15 (left) and J1610 (middle). The ribbon shows the quadratic sum of the standard deviation of the intensity across pixels in each radial bin and the rms of the observations divided by the square root of the number of independent beams sampling the same radial bin in the azimuthal direction. The Gaussian profile in the top right corner of the panels shows the FWHM of the average of major and minor axis of the synthesized beam. Right: azimuthal average of the south-east, north-west sides of LkCa 15, respectively, where the disk has been divided in two sub-regions along the major axis. The inner shoulder is more prominent in the south-east side of the disk.
Current usage metrics show cumulative count of Article Views (full-text article views including HTML views, PDF and ePub downloads, according to the available data) and Abstracts Views on Vision4Press platform.
Data correspond to usage on the plateform after 2015. The current usage metrics is available 48-96 hours after online publication and is updated daily on week days.
Initial download of the metrics may take a while.