Fig. D.1
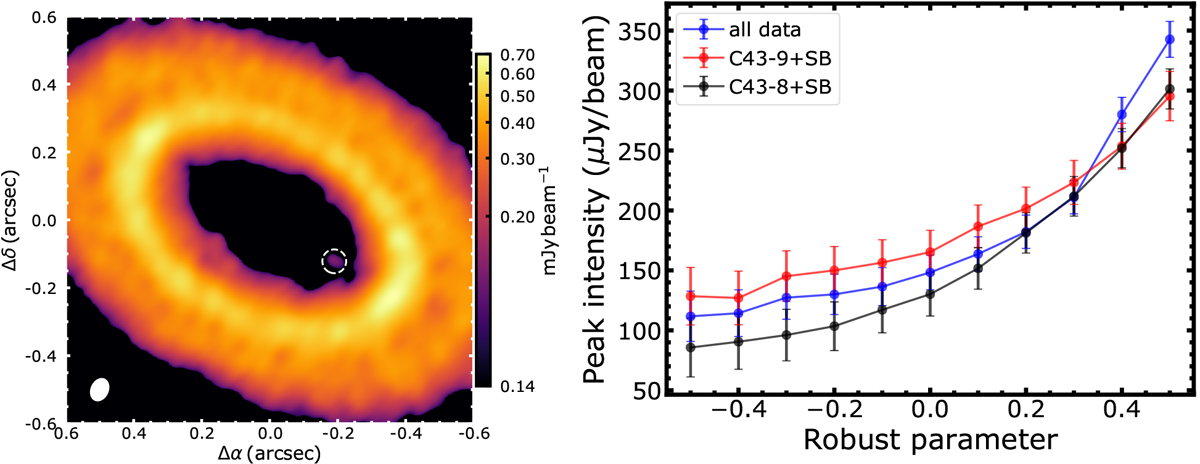
Left: zoom onto the cavity of LkCa 15, with stretched color scale to emphasize the fainter emission within the cavity. The white dashed circle indicates the presence of a potential point source within the cavity. Right: peak intensity of the potential point source in images generated with Briggs weighting but different robust parameters. The angular resolution is decreasing going from the left to the right of the plot. Different colors show the same analysis performed on the full data set, or on datasets including the short baselines and one of the two long baselines execution blocks, with C43-9 beingthe execution block of July 13th, and C43-8 being the execution block of July 19th (labeled following the nominal configurations of the observations.)
Current usage metrics show cumulative count of Article Views (full-text article views including HTML views, PDF and ePub downloads, according to the available data) and Abstracts Views on Vision4Press platform.
Data correspond to usage on the plateform after 2015. The current usage metrics is available 48-96 hours after online publication and is updated daily on week days.
Initial download of the metrics may take a while.