Free Access
Fig. B.2
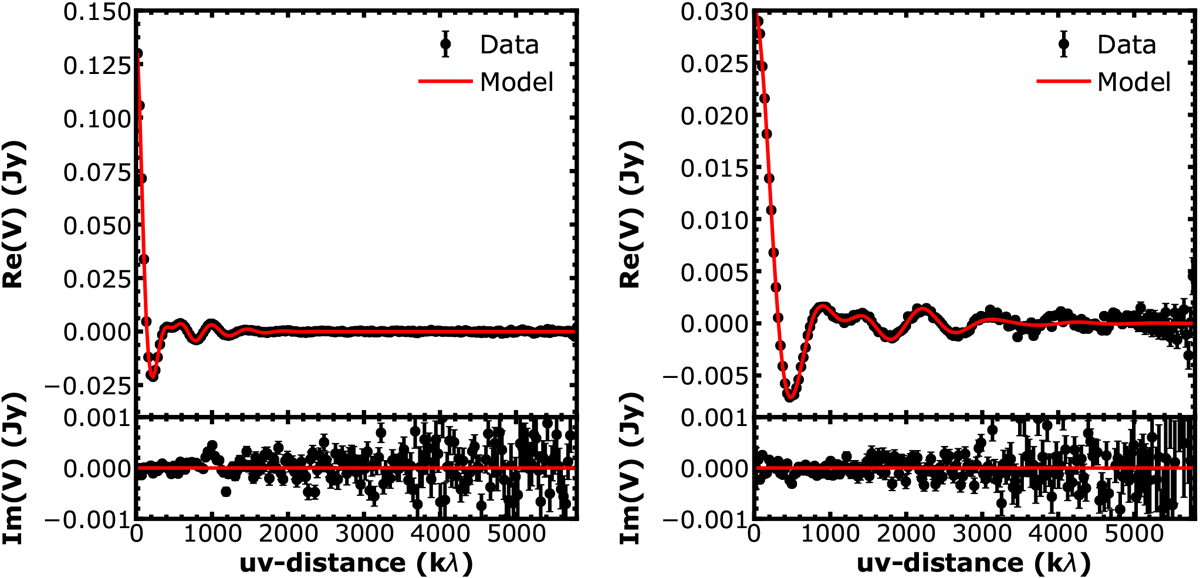
Re-centered and deprojected visibililities of the data and best fit model for LkCa 15 (left panel) and J1610 (right panel). Error bars show 1σ uncertainties. The parameters of the best fits are listed in Tables 2 and 3. The plots have been made with the uvplot package (Tazzari 2017).
Current usage metrics show cumulative count of Article Views (full-text article views including HTML views, PDF and ePub downloads, according to the available data) and Abstracts Views on Vision4Press platform.
Data correspond to usage on the plateform after 2015. The current usage metrics is available 48-96 hours after online publication and is updated daily on week days.
Initial download of the metrics may take a while.