Fig. 3.
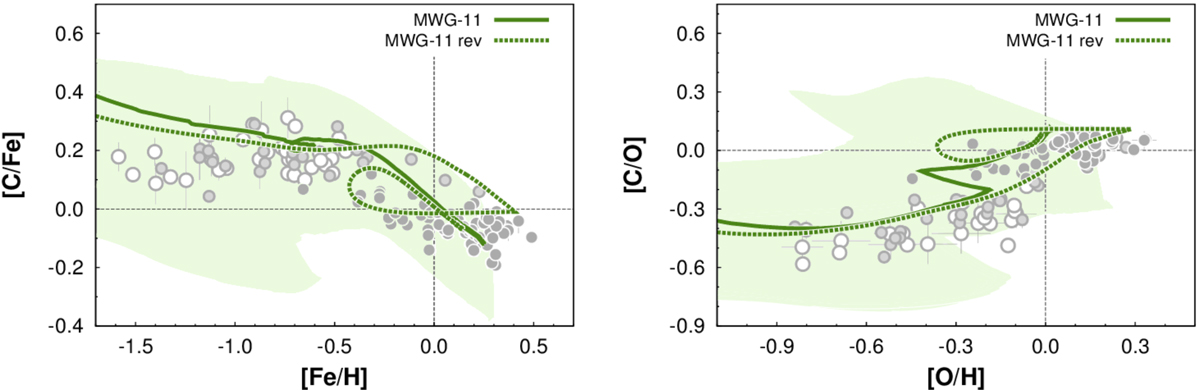
Carbon-to-iron (left panel) and carbon-to-oxygen (right panel) abundance ratios as functions of [Fe/H] and [O/H], respectively, in the solar vicinity. The solid lines show the predictions of model MWG-11 by Romano et al. (2019); the theoretical uncertainties arising from stellar nucleosynthesis are highlighted by the pale green areas. The dashed lines show the predictions of model MWG-11 revised following Spitoni et al. (2019, see text and Table 1). The symbols represent 3D non-LTE abundance estimates from high-resolution spectra of thin-disc, thick-disc, and high-α halo stars (dark grey filled circles, light grey filled circles and empty circles, respectively; Amarsi et al. 2019); in most cases, the observational error lies within the symbol size. All abundance ratios were normalised to the solar photospheric composition by Asplund et al. (2009).
Current usage metrics show cumulative count of Article Views (full-text article views including HTML views, PDF and ePub downloads, according to the available data) and Abstracts Views on Vision4Press platform.
Data correspond to usage on the plateform after 2015. The current usage metrics is available 48-96 hours after online publication and is updated daily on week days.
Initial download of the metrics may take a while.