Fig. 6.
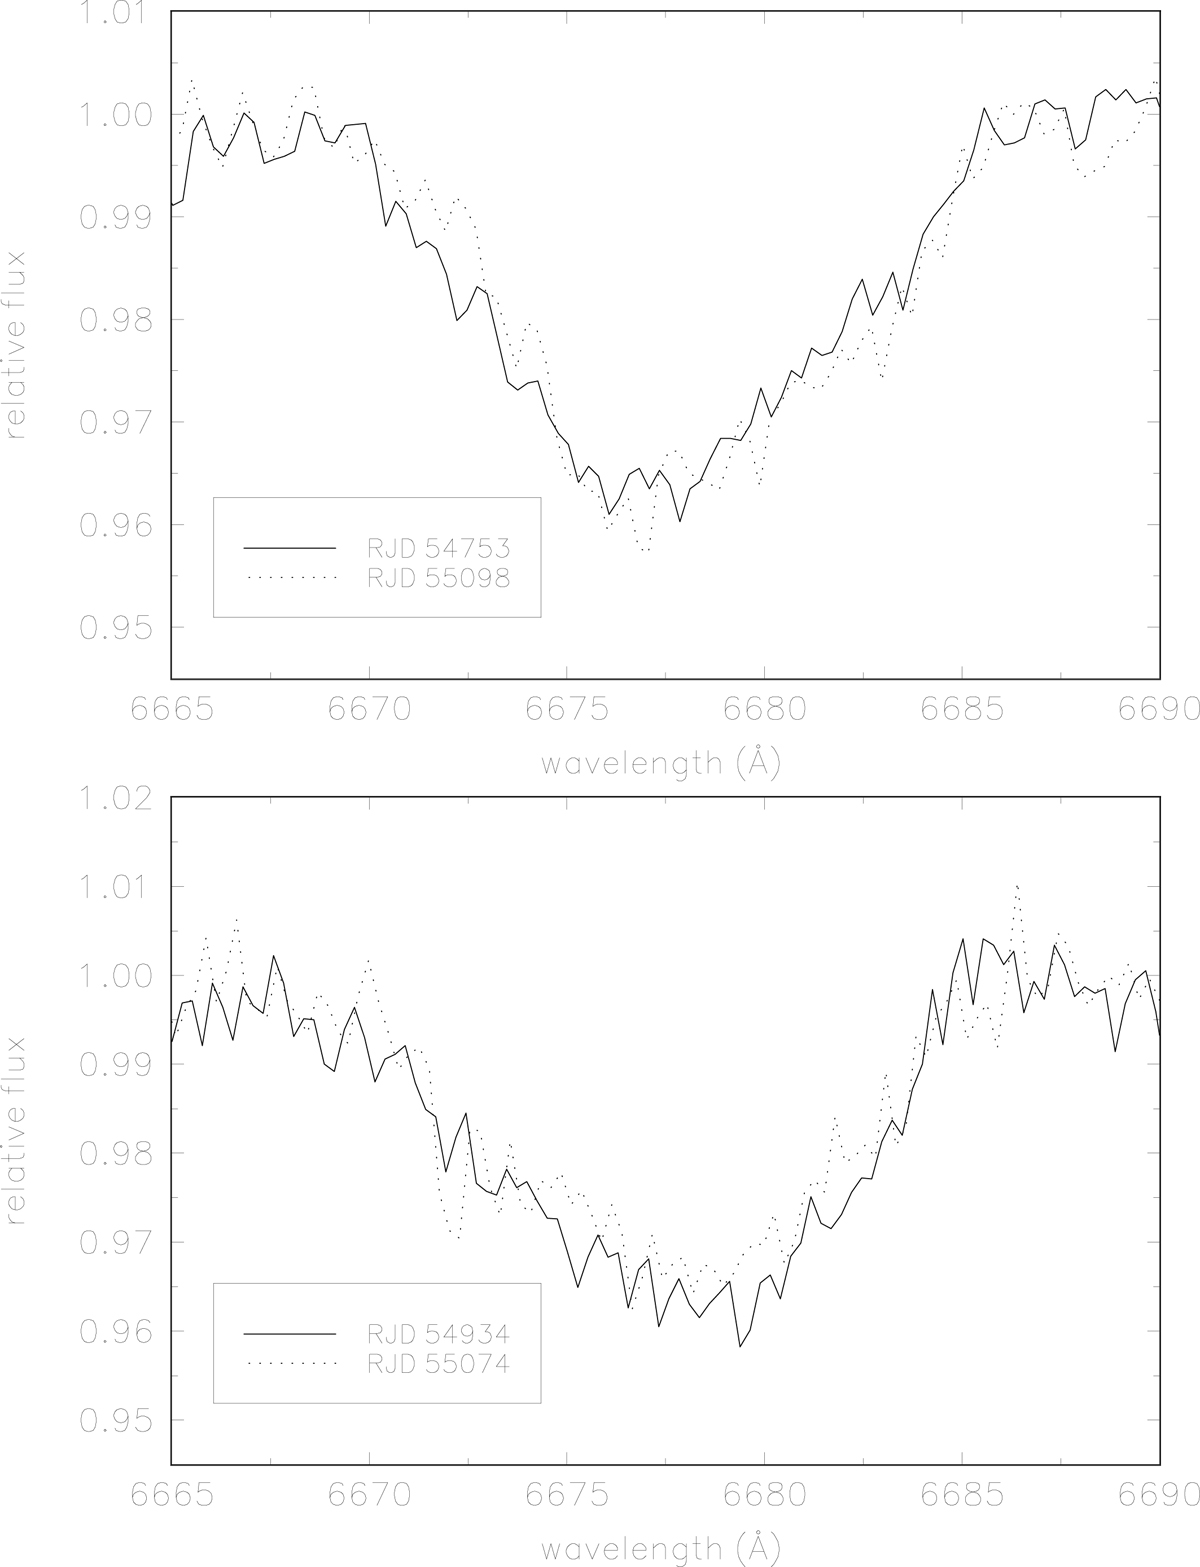
Comparison of the OND spectra from different orbital cycles in the vicinity of the He I 6678 Å line. Top panel: spectra from the elongation with the maximum RV of the primary. Bottom panel: two spectra from the other elongation with minimum RV of the primary. The line asymmetry can clearly be seen to vary with orbital phase.
Current usage metrics show cumulative count of Article Views (full-text article views including HTML views, PDF and ePub downloads, according to the available data) and Abstracts Views on Vision4Press platform.
Data correspond to usage on the plateform after 2015. The current usage metrics is available 48-96 hours after online publication and is updated daily on week days.
Initial download of the metrics may take a while.