Fig. 4.
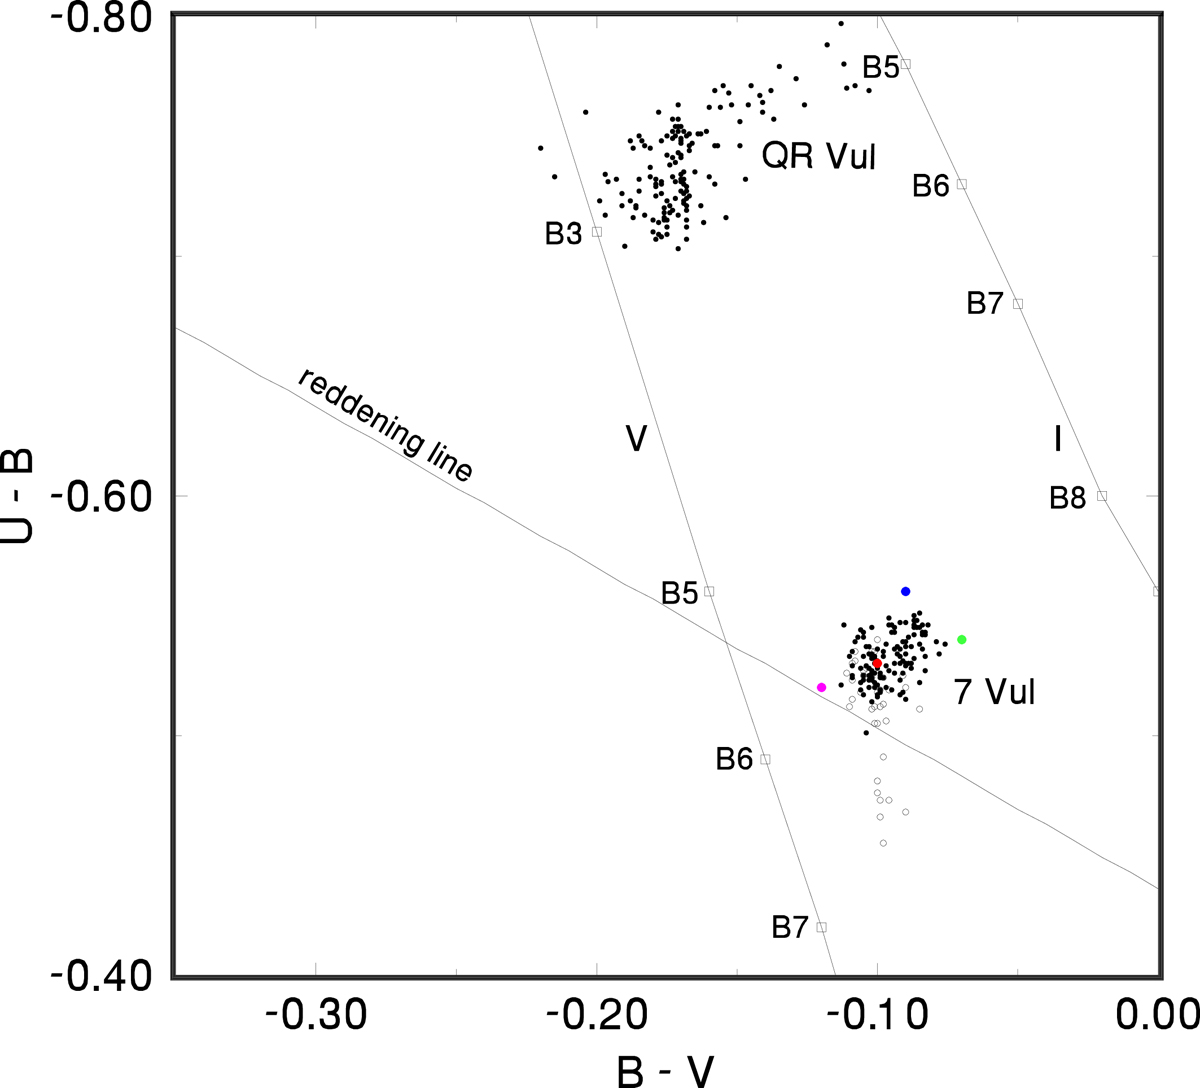
Variation of 7 Vul in the U − B vs. B − V diagram. Also shown for comparison are the variations of another Be star observed at Hvar: QR Vul. Data from individual observing stations listed in Table 2 are shown by coloured circles as follows: 01: black; 10: red; 13: open black circles; 42: magenta; 112: blue; 113: green. We note that the peculiar behavior of observations from station 13 might be due to variability of the comparison star V395 Vul, and not variability of 7 Vul itself.
Current usage metrics show cumulative count of Article Views (full-text article views including HTML views, PDF and ePub downloads, according to the available data) and Abstracts Views on Vision4Press platform.
Data correspond to usage on the plateform after 2015. The current usage metrics is available 48-96 hours after online publication and is updated daily on week days.
Initial download of the metrics may take a while.