Fig. 2.
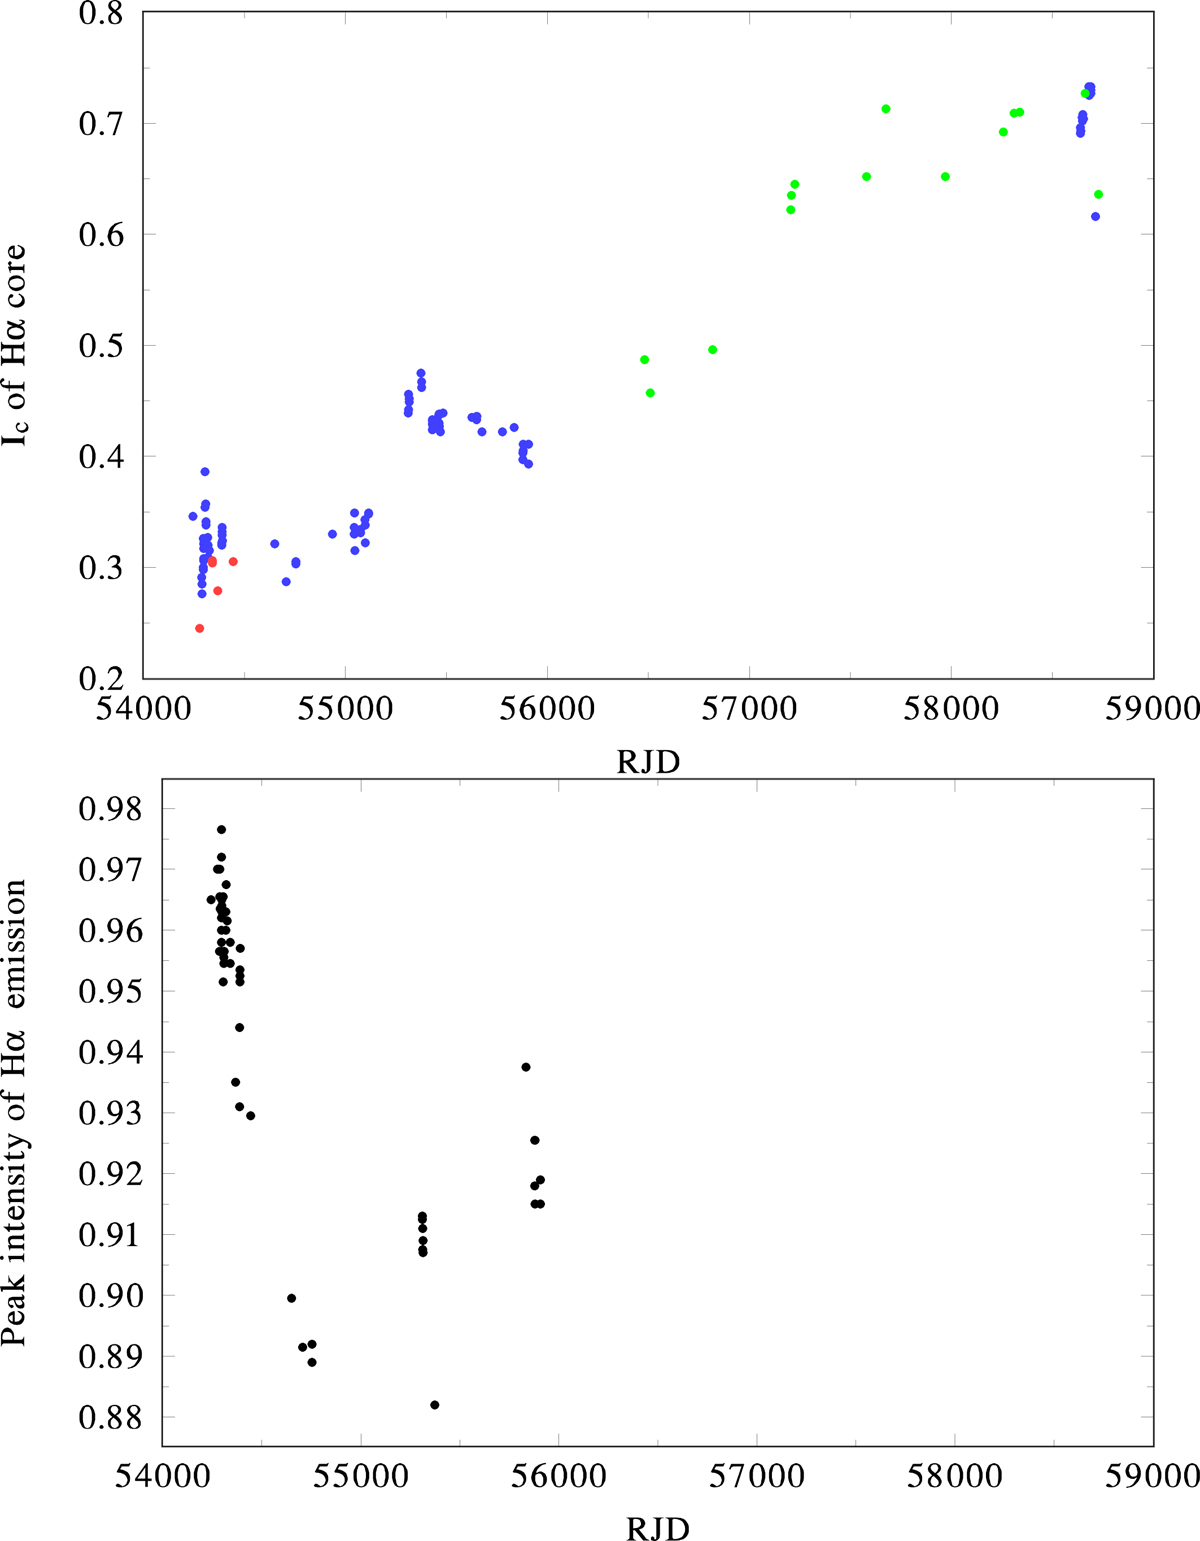
Top: evolution of the central intensity of Hα absorption core over the time interval covered by available data. Individual datasets are distinguished as follows: Red: DAO spectra; blue: Ondřejov spectra, green: amateur spectra from the BeSS database. Bottom: time evolution of the peak intensity (V + R)/2 of the Hα emission over the same interval of time.
Current usage metrics show cumulative count of Article Views (full-text article views including HTML views, PDF and ePub downloads, according to the available data) and Abstracts Views on Vision4Press platform.
Data correspond to usage on the plateform after 2015. The current usage metrics is available 48-96 hours after online publication and is updated daily on week days.
Initial download of the metrics may take a while.