Fig. 9
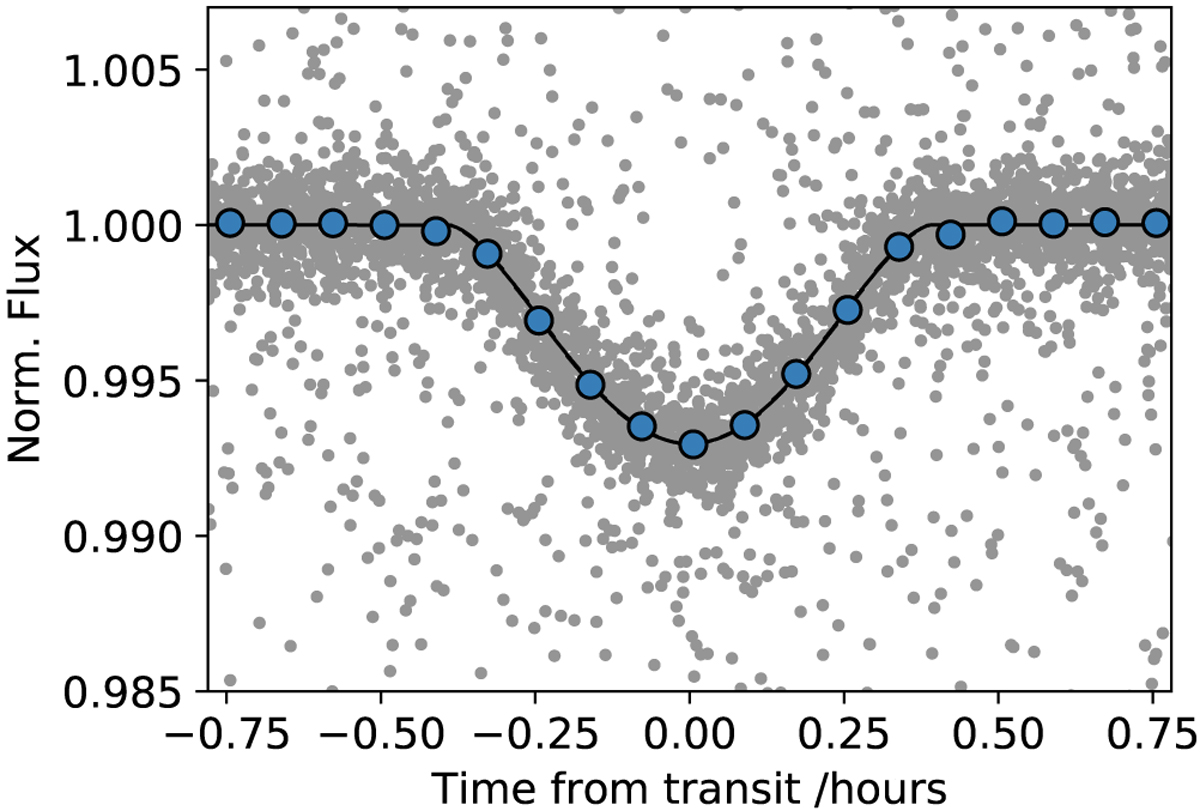
Phase folded transit light curve for HIP 65Ab including data from two TESS Sectors (see Fig. 5for the full TESS light curve) and ground based follow-up photometry. Individual follow-up light curves are shown in Fig. B.1. Grey points are the un-binned data. The points with large scatter come from the NGTS 10 sec cadence observations. In blue are the data binned to 5 min in phase space.
Current usage metrics show cumulative count of Article Views (full-text article views including HTML views, PDF and ePub downloads, according to the available data) and Abstracts Views on Vision4Press platform.
Data correspond to usage on the plateform after 2015. The current usage metrics is available 48-96 hours after online publication and is updated daily on week days.
Initial download of the metrics may take a while.