Fig. 8
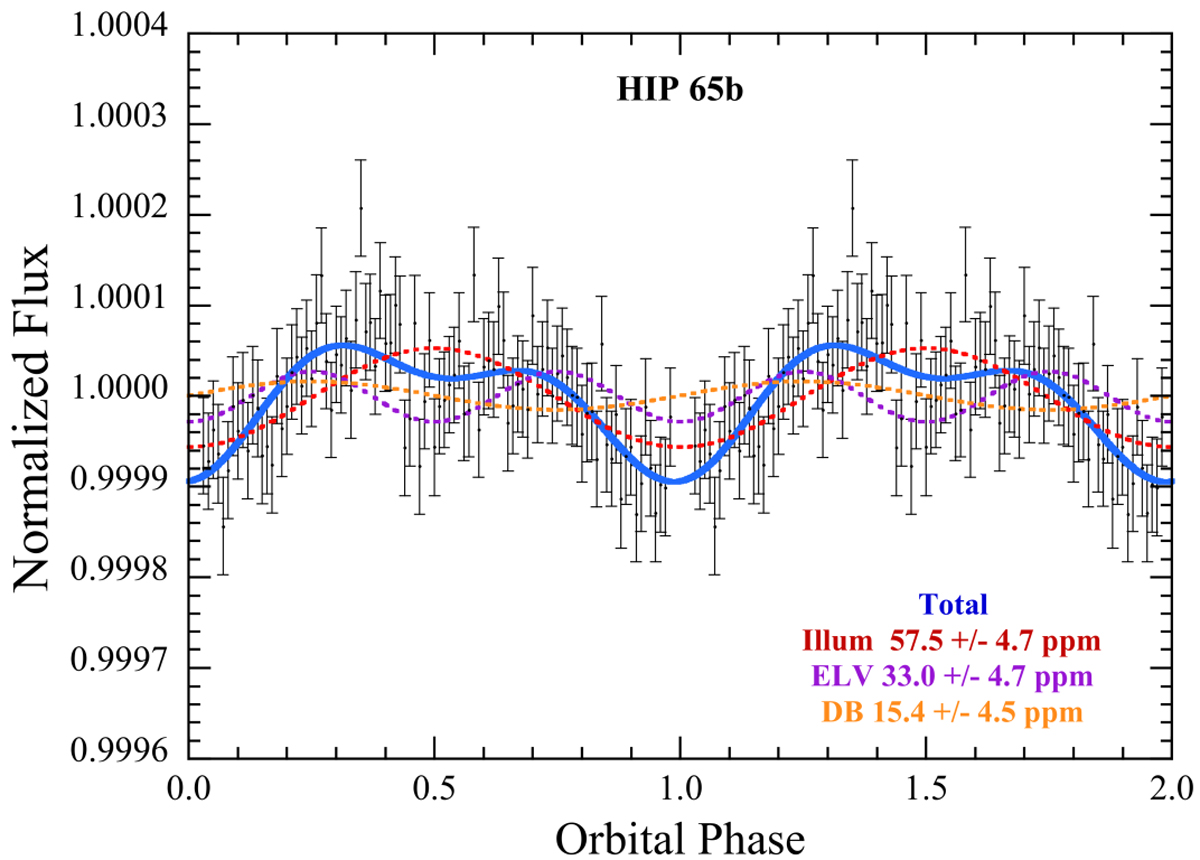
Out-of-transit folded and binned TESS light curve for HIP 65Ab. The red, purple, and orange curves are sinusoids meant to represent the illumination, ellipsoidal light variations, and Doppler boosting effects, respectively (see text for details). The blue curve is the sum of these and represents the best fit of this model to the out-of-transit light curve.
Current usage metrics show cumulative count of Article Views (full-text article views including HTML views, PDF and ePub downloads, according to the available data) and Abstracts Views on Vision4Press platform.
Data correspond to usage on the plateform after 2015. The current usage metrics is available 48-96 hours after online publication and is updated daily on week days.
Initial download of the metrics may take a while.