Free Access
Fig. B.3
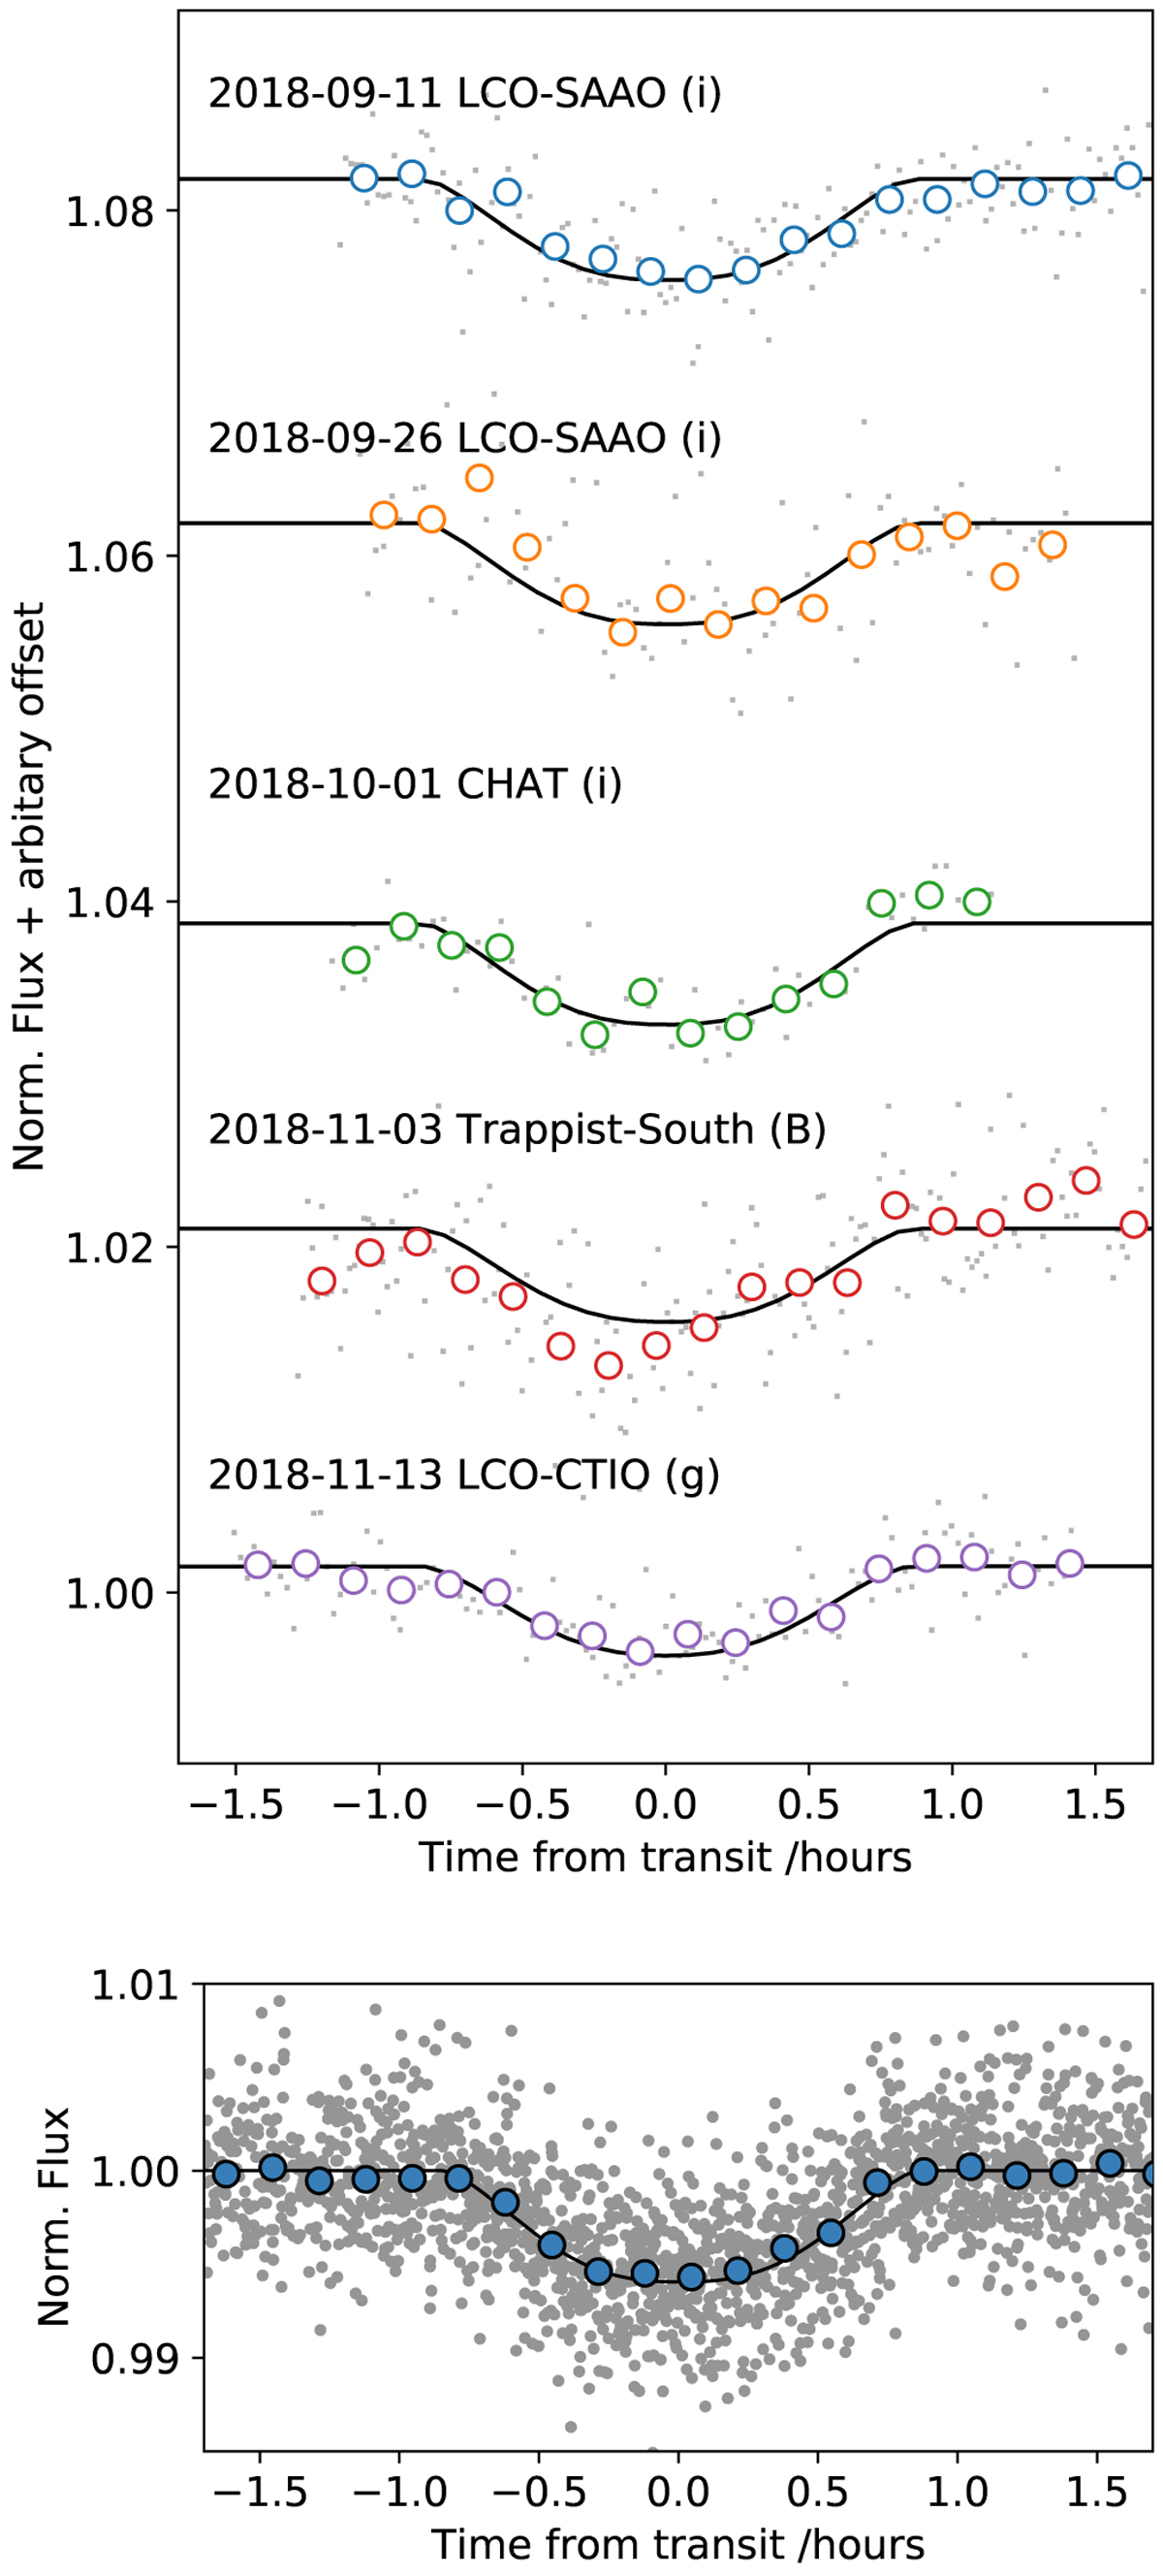
Top: ground based photometric follow-up data for TOI-169 The open circles are data binned to 10 min. Bottom: phase folded transit light curve for TOI-169 including TESS data and follow-up photometry, also with 10 min bins over-plotted as blue circles.
Current usage metrics show cumulative count of Article Views (full-text article views including HTML views, PDF and ePub downloads, according to the available data) and Abstracts Views on Vision4Press platform.
Data correspond to usage on the plateform after 2015. The current usage metrics is available 48-96 hours after online publication and is updated daily on week days.
Initial download of the metrics may take a while.