Fig. 12
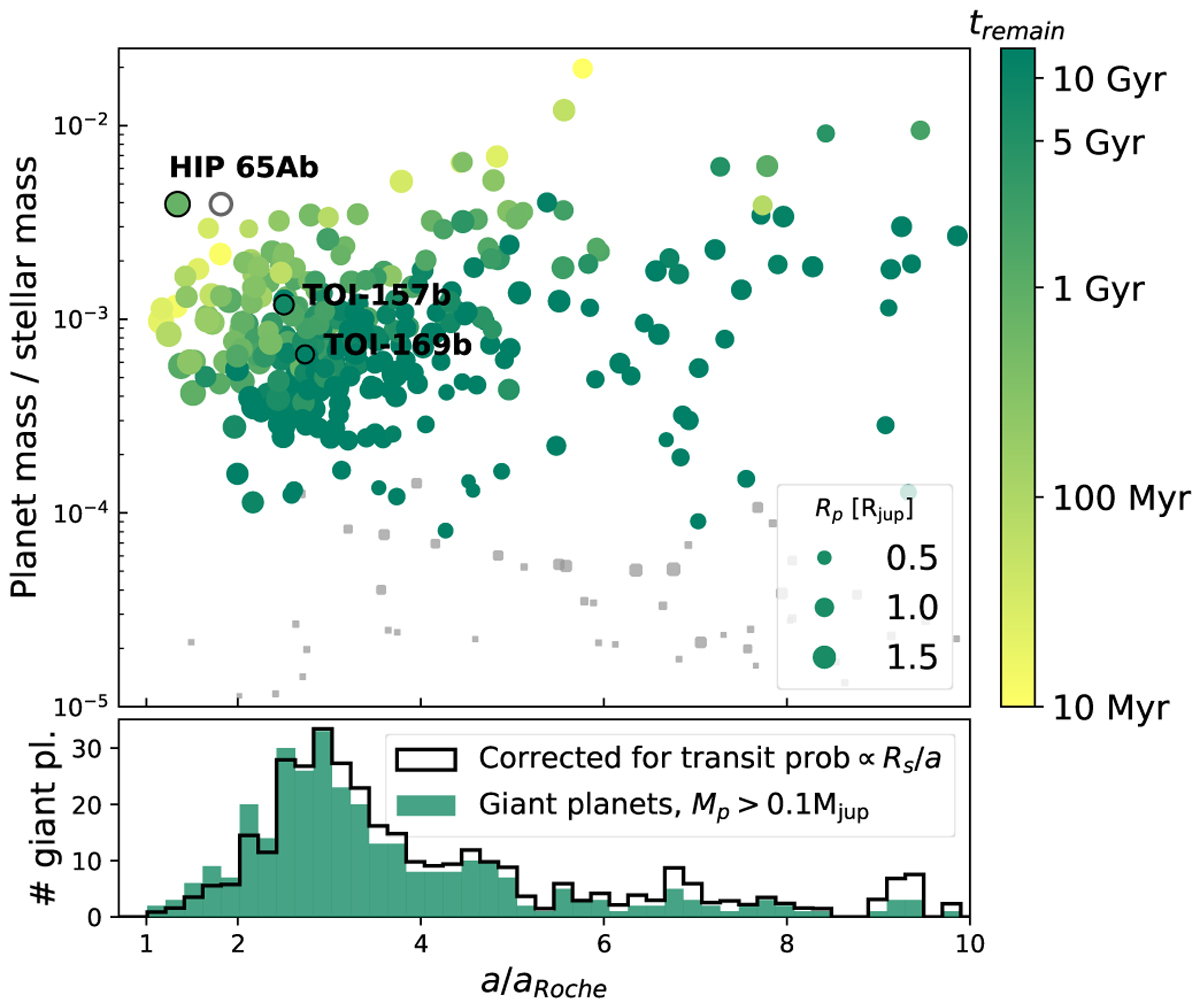
Top panel: orbital separation in units of Roche limit as a function of the planet-to-star mass ratio for the planets as in Fig. 10. The symbols sizes are proportional to the planer radius and the colour-coding represents
tremain when assuming ![]() . The open grey circle is HIP 65Ab when assuming a radius of 1.5 RJ. Filled grey circles are planets with mass < 0.1MJ, which are excluded from the histogram in the bottom panel. Bottom panel: distribution of a∕aRoche for a subset of the planets from the top and Fig. 10 with masses above 0.1 MJ. The green histogram shows the raw count of planets in bins of 0.2. The solid line is the same distribution but weighted by the inverse of the transit probability for each planet.
. The open grey circle is HIP 65Ab when assuming a radius of 1.5 RJ. Filled grey circles are planets with mass < 0.1MJ, which are excluded from the histogram in the bottom panel. Bottom panel: distribution of a∕aRoche for a subset of the planets from the top and Fig. 10 with masses above 0.1 MJ. The green histogram shows the raw count of planets in bins of 0.2. The solid line is the same distribution but weighted by the inverse of the transit probability for each planet.
Current usage metrics show cumulative count of Article Views (full-text article views including HTML views, PDF and ePub downloads, according to the available data) and Abstracts Views on Vision4Press platform.
Data correspond to usage on the plateform after 2015. The current usage metrics is available 48-96 hours after online publication and is updated daily on week days.
Initial download of the metrics may take a while.