Open Access
Fig. 8
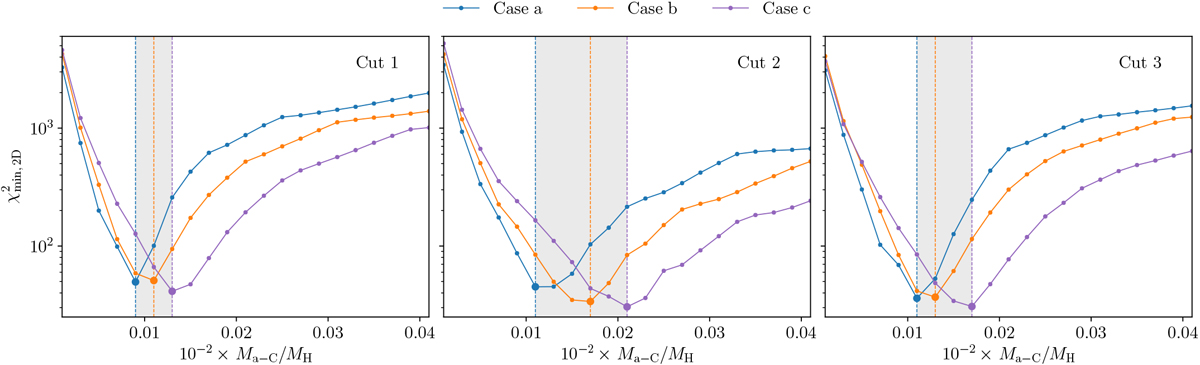
![]() as a function of Ma−C/MH for cut 1 (left), cut 2 (middle) and cut 3 (right). Blue lines refer to case a, orange lines to case b, and purple lines to case c. Vertical dashed lines correspond to the minima of
as a function of Ma−C/MH for cut 1 (left), cut 2 (middle) and cut 3 (right). Blue lines refer to case a, orange lines to case b, and purple lines to case c. Vertical dashed lines correspond to the minima of
![]() (i.e.
(i.e.
![]() ).
).
Current usage metrics show cumulative count of Article Views (full-text article views including HTML views, PDF and ePub downloads, according to the available data) and Abstracts Views on Vision4Press platform.
Data correspond to usage on the plateform after 2015. The current usage metrics is available 48-96 hours after online publication and is updated daily on week days.
Initial download of the metrics may take a while.