Fig. 7
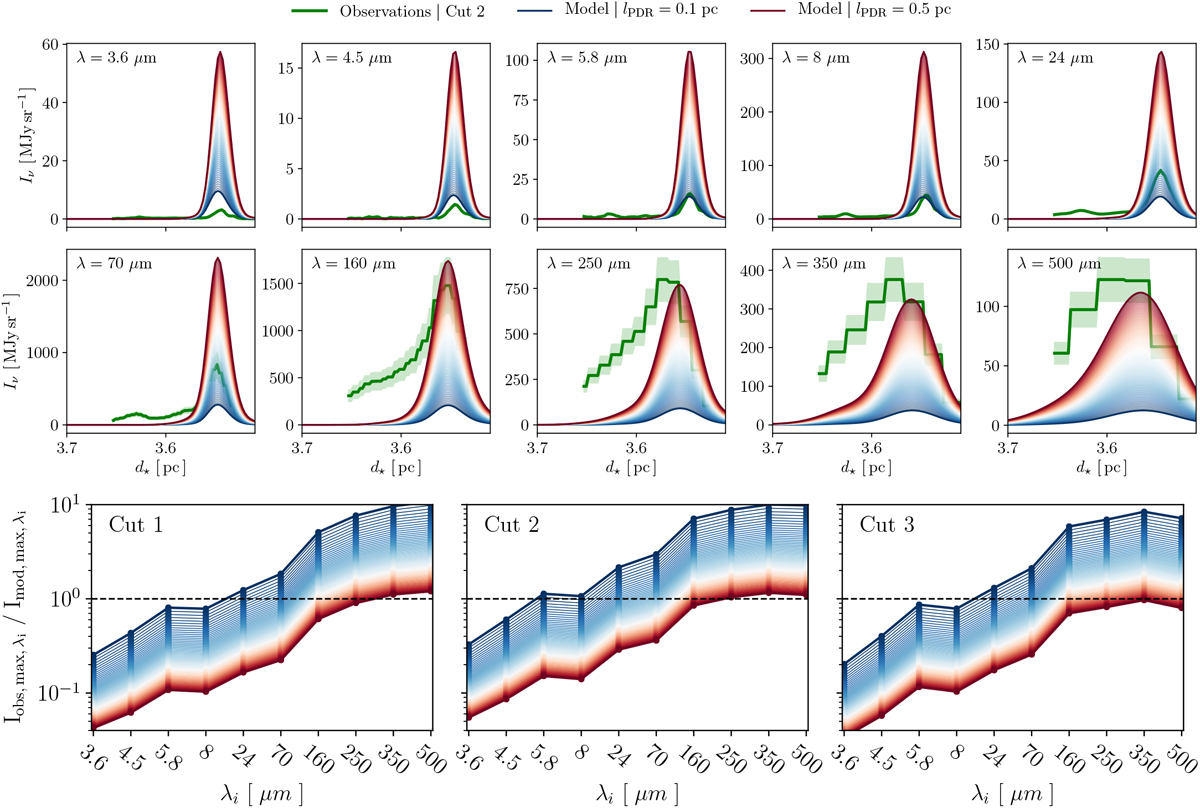
Top: modelled dust emission for lPDR varying from 0.1 pc (blue lines) to 0.5 pc (red lines) in steps of 0.01 pc for the ten photometric bands with diffuse ISM-like dust. The observed dust emission for cut 2 is shown by green lines. Bottom: ratio between the highest observed and modelled dust emissions in the ten photometric bands for the three cuts and lPDR varying from 0.01 pc (blue lines) to 0.5 pc (red lines) in steps of 0.01 pc.
Current usage metrics show cumulative count of Article Views (full-text article views including HTML views, PDF and ePub downloads, according to the available data) and Abstracts Views on Vision4Press platform.
Data correspond to usage on the plateform after 2015. The current usage metrics is available 48-96 hours after online publication and is updated daily on week days.
Initial download of the metrics may take a while.