Fig. 5
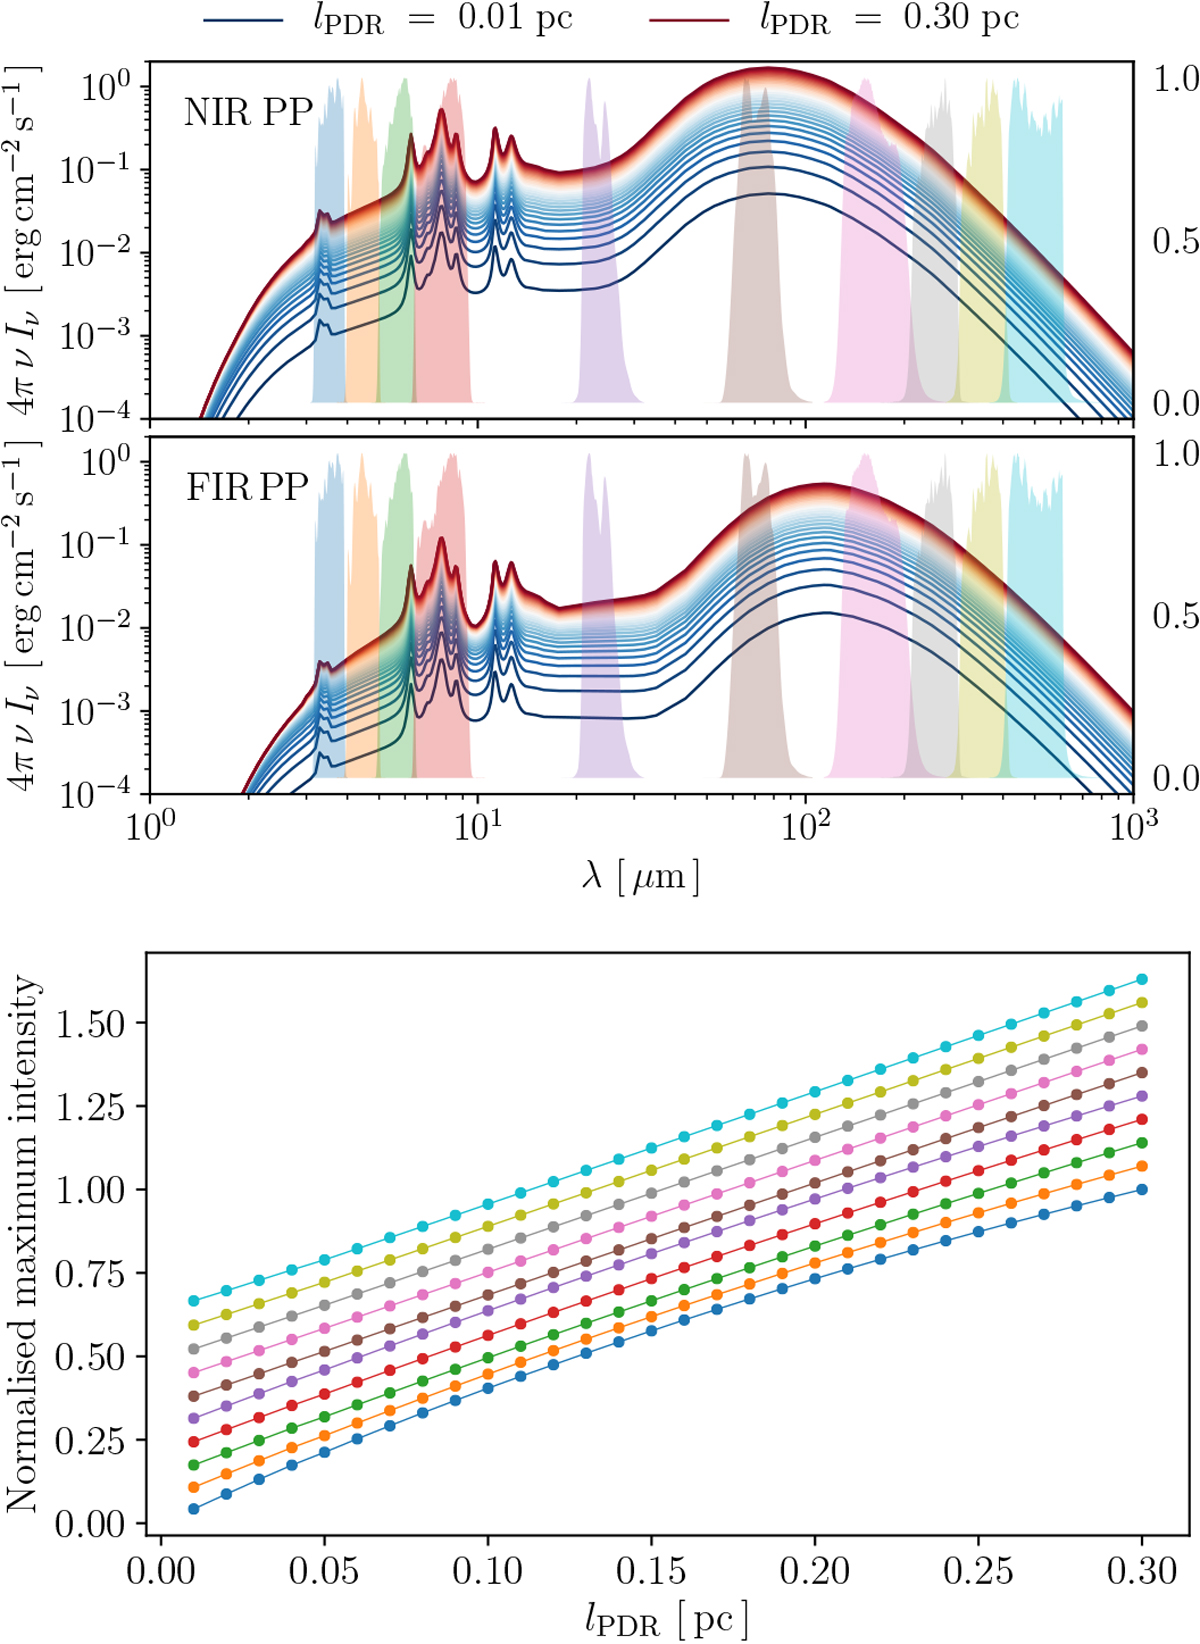
Top: dust-modelled spectra with SOC and using CM grains, i.e. diffuse ISM-like dust, at the near-IR peak position (NIR PP) for lPDR varying from 0.01 pc (blue line) to 0.30 pc (red line) with a step of 0.01 pc. The ten photometric bands are shown in colours behind the lines. Middle: same at the far-IR peak position (FIR PP). Bottom: normalised Imod, max(i) for each band as a function of lPDR. Colours refer to the different photometric bands shown in the upper panels. Lines are shifted for clarification (from top to bottom in the order of decreasing wavelength).
Current usage metrics show cumulative count of Article Views (full-text article views including HTML views, PDF and ePub downloads, according to the available data) and Abstracts Views on Vision4Press platform.
Data correspond to usage on the plateform after 2015. The current usage metrics is available 48-96 hours after online publication and is updated daily on week days.
Initial download of the metrics may take a while.