Fig. 4
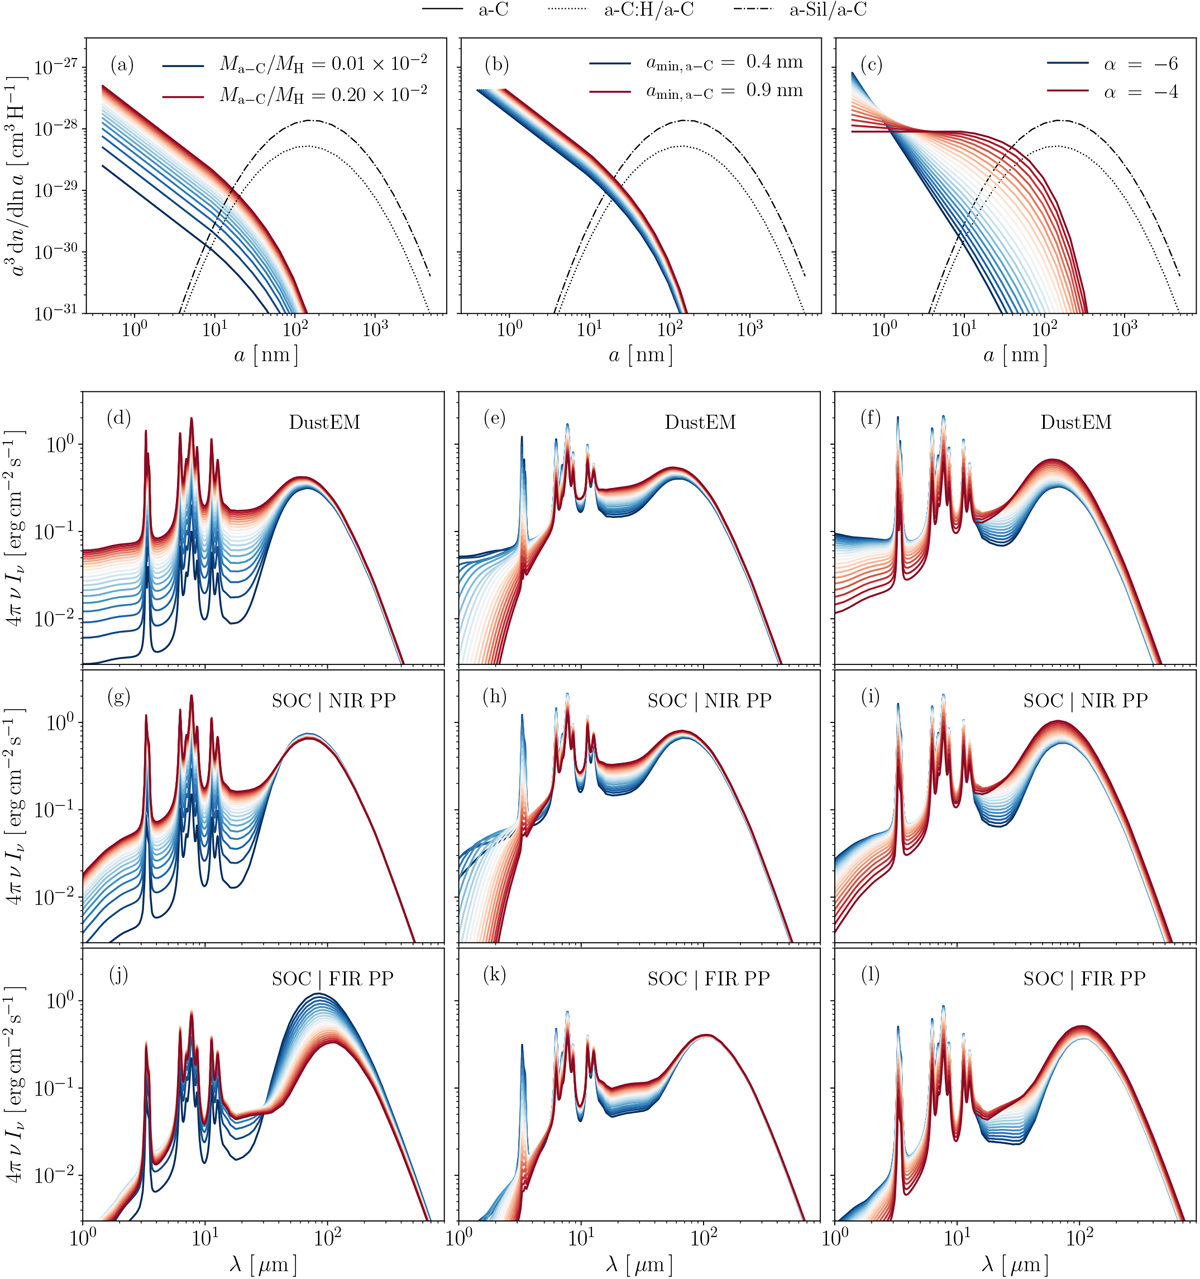
Dust size distributions for different values of Ma−C/MH (panel a), amin, a−C (panel b) and α (panel c). Panels d–l: dust spectra for the size distributions shown in the corresponding top-row panels. The spectra are computed with DustEM (panels d–f) and with radiative transfer for the near-IR (panels g–i) and the far-IR (panels j–l) peak positions.
Current usage metrics show cumulative count of Article Views (full-text article views including HTML views, PDF and ePub downloads, according to the available data) and Abstracts Views on Vision4Press platform.
Data correspond to usage on the plateform after 2015. The current usage metrics is available 48-96 hours after online publication and is updated daily on week days.
Initial download of the metrics may take a while.