Fig. 12
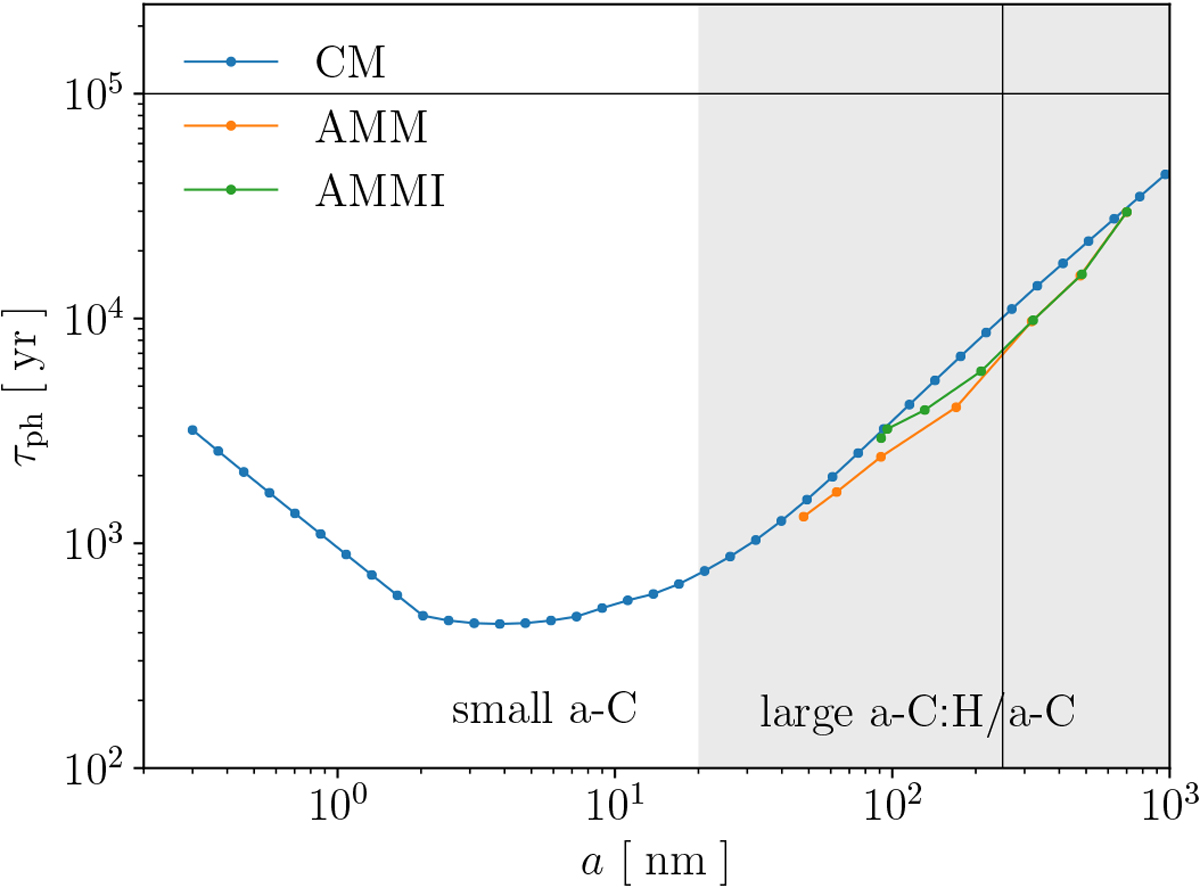
Photo-fragmentation timescale at the Horsehead edge as a function of the grain radius, a. The blue line refers to CM grains, the orange line to AMM grains, and the green line to AMMI grains. The horizontal black line corresponds to the advection timescale τa ~ 105 yr in the outer part of the Horsehead. The vertical black line corresponds to the limit at 250 nm beyond which more than 50% of the AMM(I) dust mass is contained (Ysard et al. 2016). The darker grey part corresponds to sizes that cover large a-C:H/a-C grains.
Current usage metrics show cumulative count of Article Views (full-text article views including HTML views, PDF and ePub downloads, according to the available data) and Abstracts Views on Vision4Press platform.
Data correspond to usage on the plateform after 2015. The current usage metrics is available 48-96 hours after online publication and is updated daily on week days.
Initial download of the metrics may take a while.