Fig. 13.
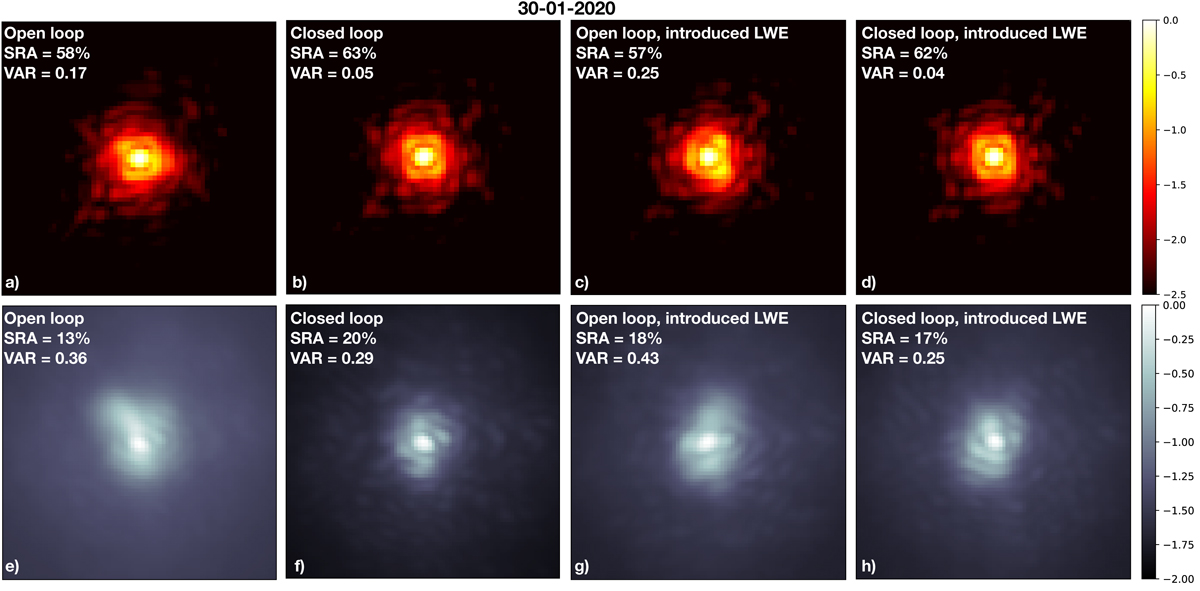
Averaged PSFs from four different on-sky experiments. The top row shows the PSFs in the NIR, while the bottom row shows the PSFs in the optical. All PSFs are normalized to their maximum value, and are plotted in logarithmic scale. (a) and (e): PSFs while the F&F loop was open and no (previous) F&F DM correction applied. The optical PSF is significantly distorted. (b) and (f): PSFs while the F&F was closed. Both PSFs improved, a clear sign that aberrations common to both the optical and NIR path were (partially) corrected. (c) and (g): PSFs while the F&F loop was opened and a LWE-like wavefront was applied by the DM, but no F&F correction was applied. (d) and (h): closed loop PSFs with the LWE introduced on the DM, which was successfully corrected.
Current usage metrics show cumulative count of Article Views (full-text article views including HTML views, PDF and ePub downloads, according to the available data) and Abstracts Views on Vision4Press platform.
Data correspond to usage on the plateform after 2015. The current usage metrics is available 48-96 hours after online publication and is updated daily on week days.
Initial download of the metrics may take a while.