Fig. 11.
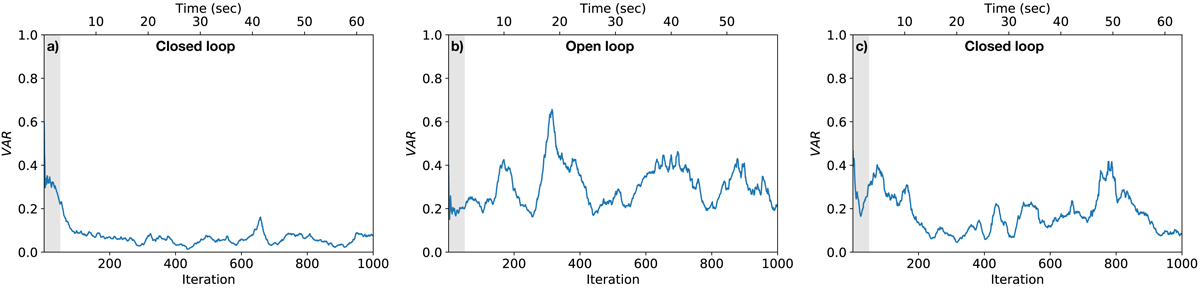
Measurements of VAR on running average images during three, subsequent in time, on-sky experiments. The running average image for iteration i is defined as the average of images i − 50 to i. The gray box denotes the iterations for which the full average of 50 images could not be calculated. (a) The measurements during the first closed-loop test. (b) The F&F loop was opened, i.e. gain was set to zero and its DM correction removed. (c) Loop was closed again.
Current usage metrics show cumulative count of Article Views (full-text article views including HTML views, PDF and ePub downloads, according to the available data) and Abstracts Views on Vision4Press platform.
Data correspond to usage on the plateform after 2015. The current usage metrics is available 48-96 hours after online publication and is updated daily on week days.
Initial download of the metrics may take a while.