Fig. 9.
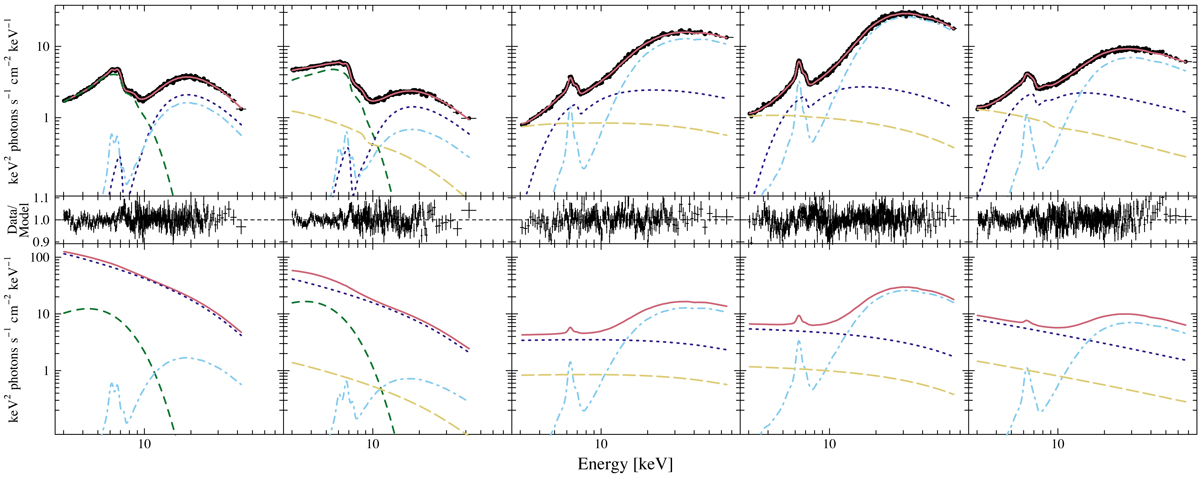
Averaged NuSTAR FPMA data from V404 Cyg in the preflare (epochs 1–2) and outburst (epochs 3–5) stages as shown in Fig. 5, together with absorbed (top row) and intrinsic (bottom row) model B components. The total model (solid red line) consists of a sum of a blackbody component (dashed green line), a cutoff power-law component absorbed in and scattered off from the material in the line of sight (dotted blue line), scattered into the line of sight by the surrounding medium (dot-dashed light blue line), and unabsorbed or direct component (long-dashed yellow line). The middle panels show the residuals of the models to the data.
Current usage metrics show cumulative count of Article Views (full-text article views including HTML views, PDF and ePub downloads, according to the available data) and Abstracts Views on Vision4Press platform.
Data correspond to usage on the plateform after 2015. The current usage metrics is available 48-96 hours after online publication and is updated daily on week days.
Initial download of the metrics may take a while.