Fig. 4.
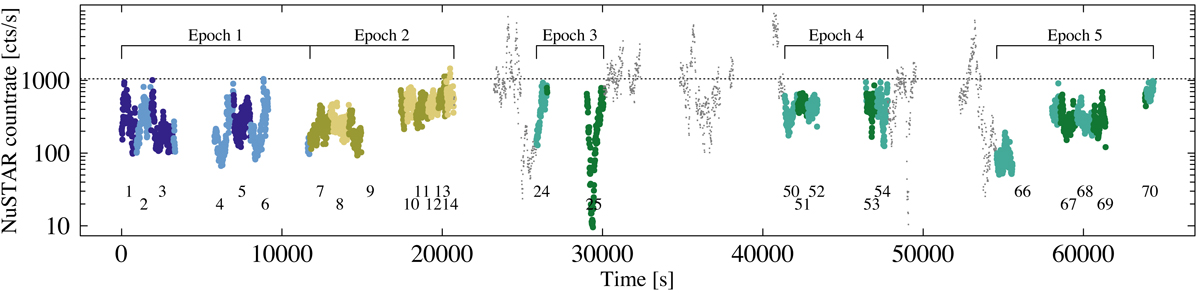
NuSTAR 3–79 keV light curve of V404 Cyg divided into GTIs that total 30 000 counts (numbered). The numbers for GTIs that include count rates exceeding 1050 cts s−1 are not shown (excluding GTIs 13 and 14), and the data points are shown in gray with a reduced point size. The coloring scheme corresponds to the spectral shape shown in Fig. 5, with every other GTI shown in a different hue for clarity.
Current usage metrics show cumulative count of Article Views (full-text article views including HTML views, PDF and ePub downloads, according to the available data) and Abstracts Views on Vision4Press platform.
Data correspond to usage on the plateform after 2015. The current usage metrics is available 48-96 hours after online publication and is updated daily on week days.
Initial download of the metrics may take a while.