Fig. 14.
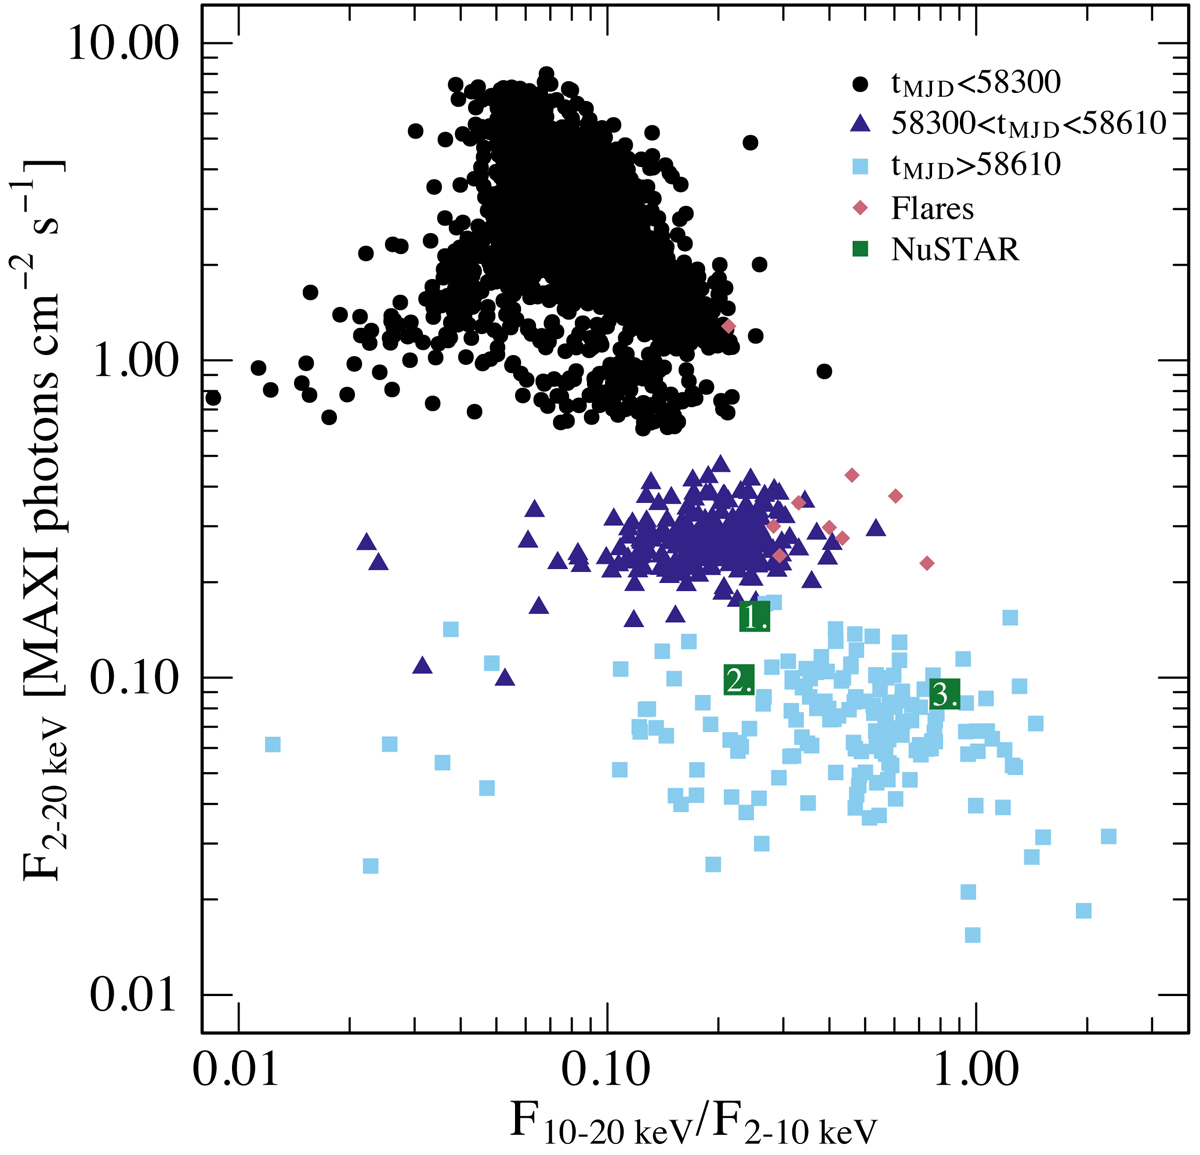
MAXI/GSC hardness-intensity diagram of GRS 1915+105 from daily monitoring observations since August 2009. The blue data points (dark triangles and light blue squares) indicate the recent low-luminosity state with increased spectral hardness. The light blue squares correspond to the anomalous state with occasional strong X-ray flares (red diamonds) and highly variable radio emission. The numbered green boxes correspond to the NuSTAR epochs.
Current usage metrics show cumulative count of Article Views (full-text article views including HTML views, PDF and ePub downloads, according to the available data) and Abstracts Views on Vision4Press platform.
Data correspond to usage on the plateform after 2015. The current usage metrics is available 48-96 hours after online publication and is updated daily on week days.
Initial download of the metrics may take a while.