Fig. 8.
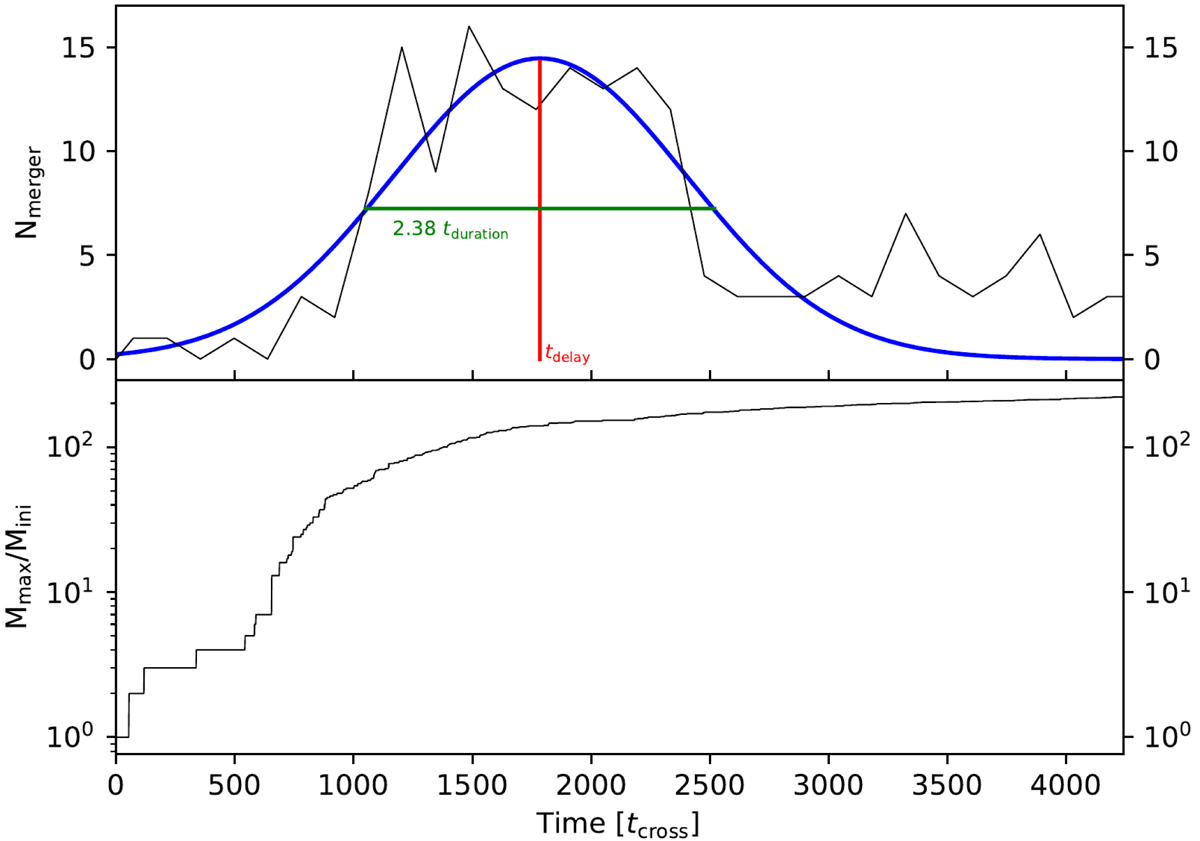
Example of a Gaussian fit to the number of mergers with the central star for simulation number 45 listed in Table 2. Top panel: number of mergers with the most massive star as a function of time (black solid line) along with the Gaussian function that we used to estimate the total number of mergers at different times. The parameters tdelay and tduration are also shown in the figure. Bottom panel: mass growth of the central star whose rapid growth coincides with the peak in the number of mergers.
Current usage metrics show cumulative count of Article Views (full-text article views including HTML views, PDF and ePub downloads, according to the available data) and Abstracts Views on Vision4Press platform.
Data correspond to usage on the plateform after 2015. The current usage metrics is available 48-96 hours after online publication and is updated daily on week days.
Initial download of the metrics may take a while.