Fig. 3.
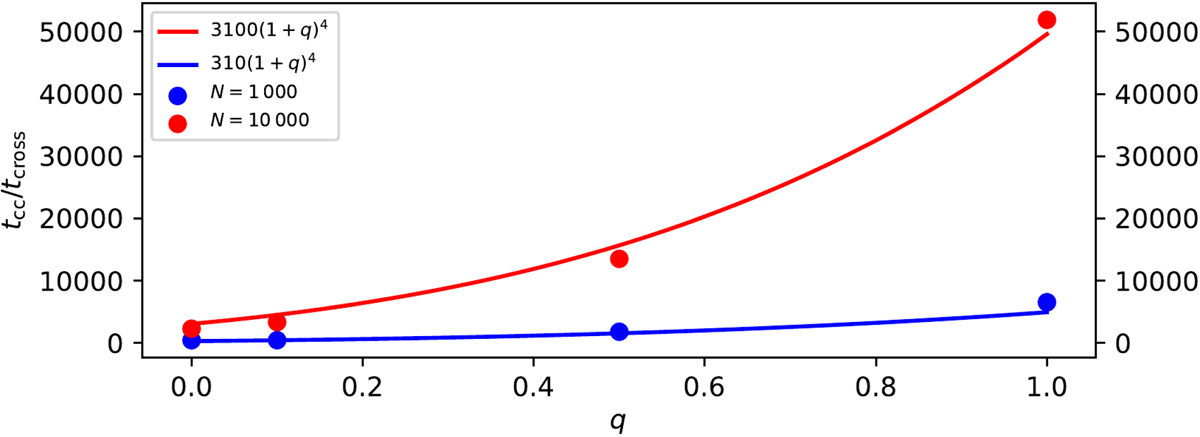
Core collapse time tcc divided by the crossing time tcross for clusters with N = 1000 (blue circles) and N = 10 000 (red circles) as a function of q = Mext/Mstars. We also plotted two relations that scale as (1 + q)4 which fit our data and therefore suggest that if the core collapse time is proportional to the relaxation time of the cluster, then the relaxation time scales as (1 + q)4, which is the same relation that we derive in Appendix A.
Current usage metrics show cumulative count of Article Views (full-text article views including HTML views, PDF and ePub downloads, according to the available data) and Abstracts Views on Vision4Press platform.
Data correspond to usage on the plateform after 2015. The current usage metrics is available 48-96 hours after online publication and is updated daily on week days.
Initial download of the metrics may take a while.