Fig. B.2.
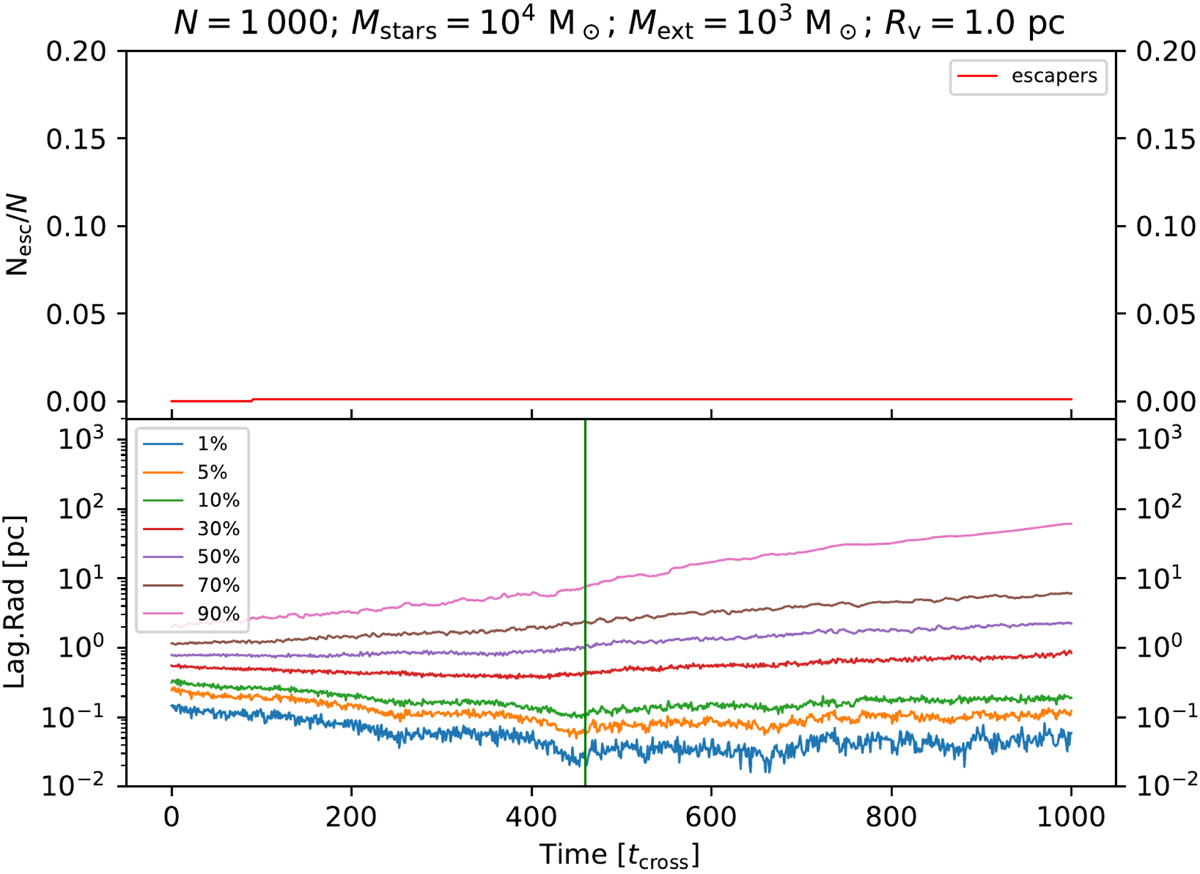
Evolution of a cluster with N = 1000 stars, total mass Mstars = 104 M⊙ and Rv = 1.0 pc in a background potential with mass Mext = 103 M⊙. Top panel: fraction of stars that were ejected from the cluster. Bottom panel: Lagrangian radius and the vertical green line marks the moment of core collapse. The time is presented in units of the crossing time of the cluster.
Current usage metrics show cumulative count of Article Views (full-text article views including HTML views, PDF and ePub downloads, according to the available data) and Abstracts Views on Vision4Press platform.
Data correspond to usage on the plateform after 2015. The current usage metrics is available 48-96 hours after online publication and is updated daily on week days.
Initial download of the metrics may take a while.