Fig. 13.
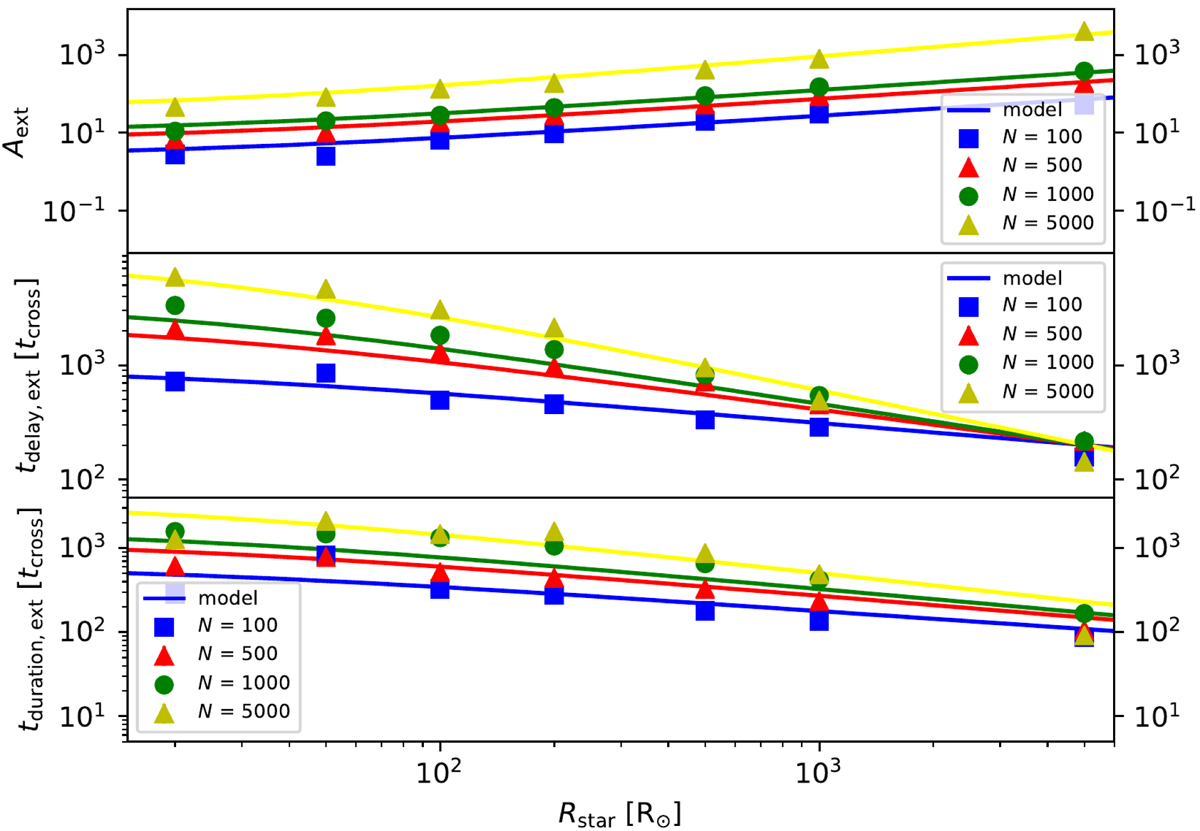
Parameters of the Gaussian fit to the number of mergers with the central star for simulations of clusters with an external potential. The data points were obtained after the fit to the combined data of six simulations. Upper panel: values of the normalization factor Aext for different values of N and Rstar along with our model from Eq. (8). These data points show that the number of mergers increases with both N and Rstar as expected. Middle panel: different values of tdelay, ext in addition to the different values of N and Rstar along with the fitting function presented in Eq. (14). These points show that tdelay, ext decreases with Rstar, but it increases with N. Additionally, these values are larger than the values of tdelay for clusters without an external potential (see Fig. 11). Lower panel: values of tduration, ext along with the fitting function from Eq. (15). We clearly see a positive correlation with N and a negative correlation with Rstar.
Current usage metrics show cumulative count of Article Views (full-text article views including HTML views, PDF and ePub downloads, according to the available data) and Abstracts Views on Vision4Press platform.
Data correspond to usage on the plateform after 2015. The current usage metrics is available 48-96 hours after online publication and is updated daily on week days.
Initial download of the metrics may take a while.