Free Access
Fig. 1.
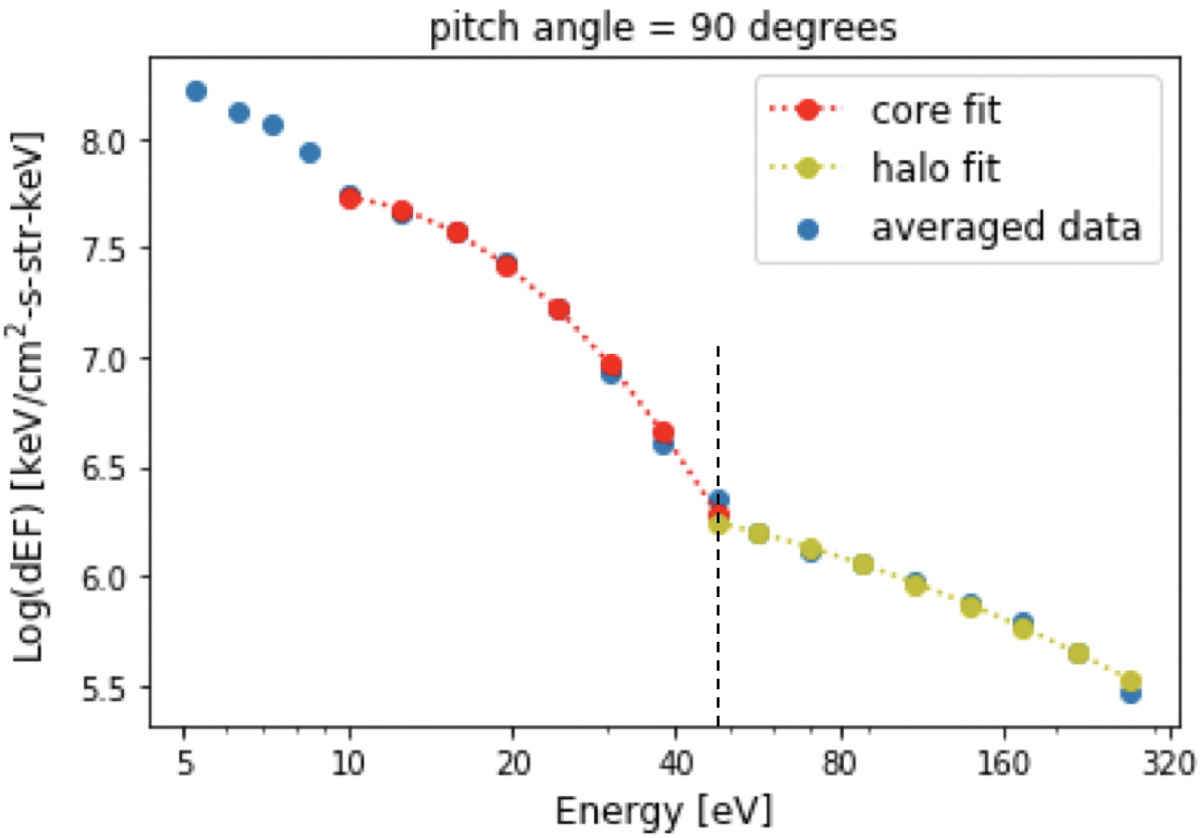
Differential energy flux as a function of energy at 90°, averaged across times 08:51–10:19 (02/03/2004) during our fast wind regime. The red curve represents a fit to the core electron energy range and the yellow curve to the halo energy range. The grey dashed line marks the so-called “breakpoint energy” at 45 ± 3 eV.
Current usage metrics show cumulative count of Article Views (full-text article views including HTML views, PDF and ePub downloads, according to the available data) and Abstracts Views on Vision4Press platform.
Data correspond to usage on the plateform after 2015. The current usage metrics is available 48-96 hours after online publication and is updated daily on week days.
Initial download of the metrics may take a while.