Fig. 1.
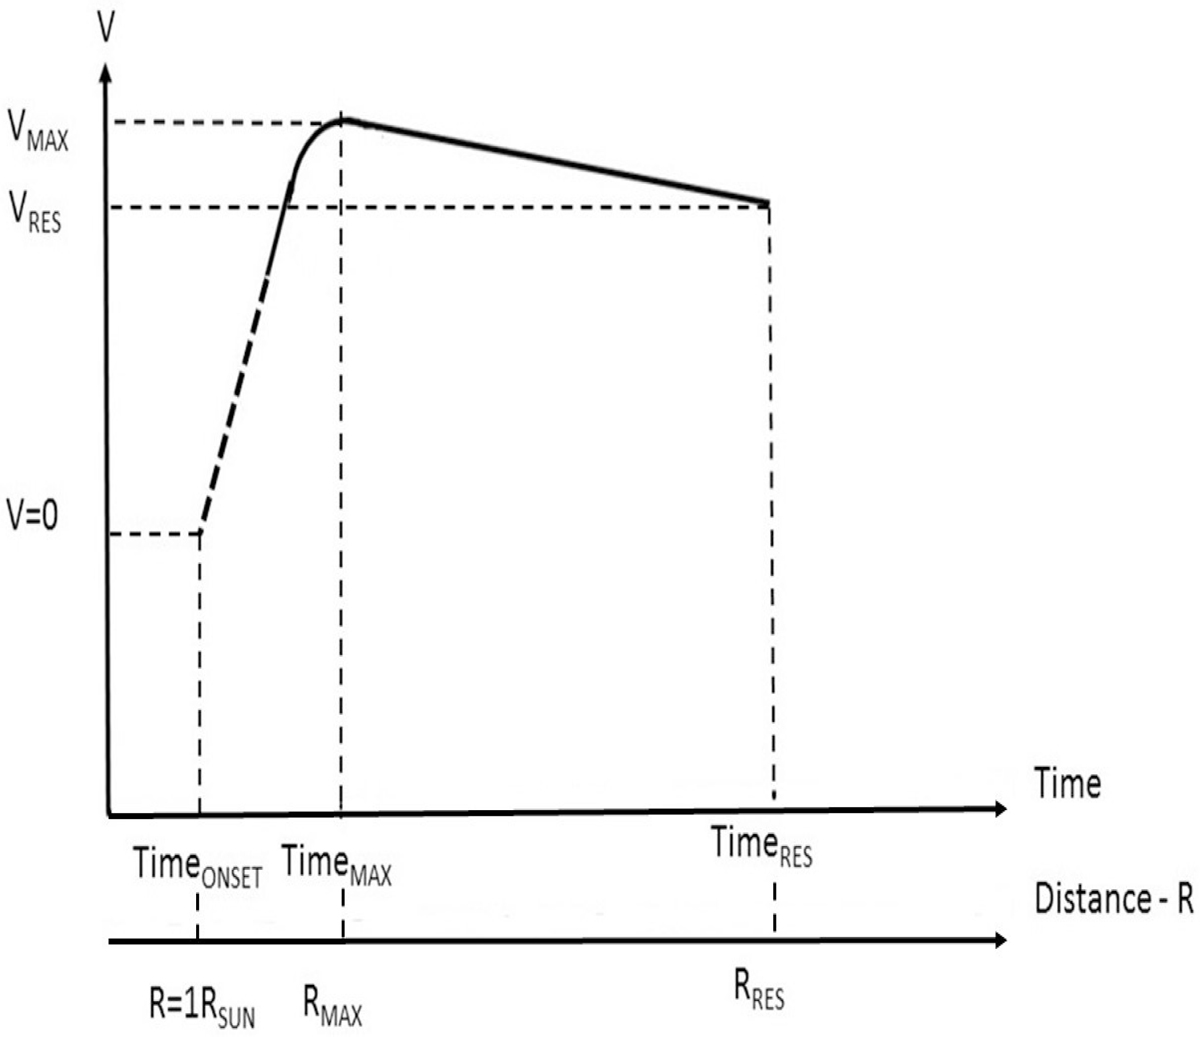
Schematic showing all the parameters introduced in this study. The continuous curve represents the characteristic shape of velocities in time and distance. The thick dashed line illustrates the extrapolation of this line to the solar surface at distance, R = 1 RSUN and velocity, V = 0 km s−1. (RMAX, RRES) and (TimeMAX, TimeRES) are distance and time at maximum velocity (VMAX) and residual velocity (VRES), respectively.
Current usage metrics show cumulative count of Article Views (full-text article views including HTML views, PDF and ePub downloads, according to the available data) and Abstracts Views on Vision4Press platform.
Data correspond to usage on the plateform after 2015. The current usage metrics is available 48-96 hours after online publication and is updated daily on week days.
Initial download of the metrics may take a while.