Fig. 6.
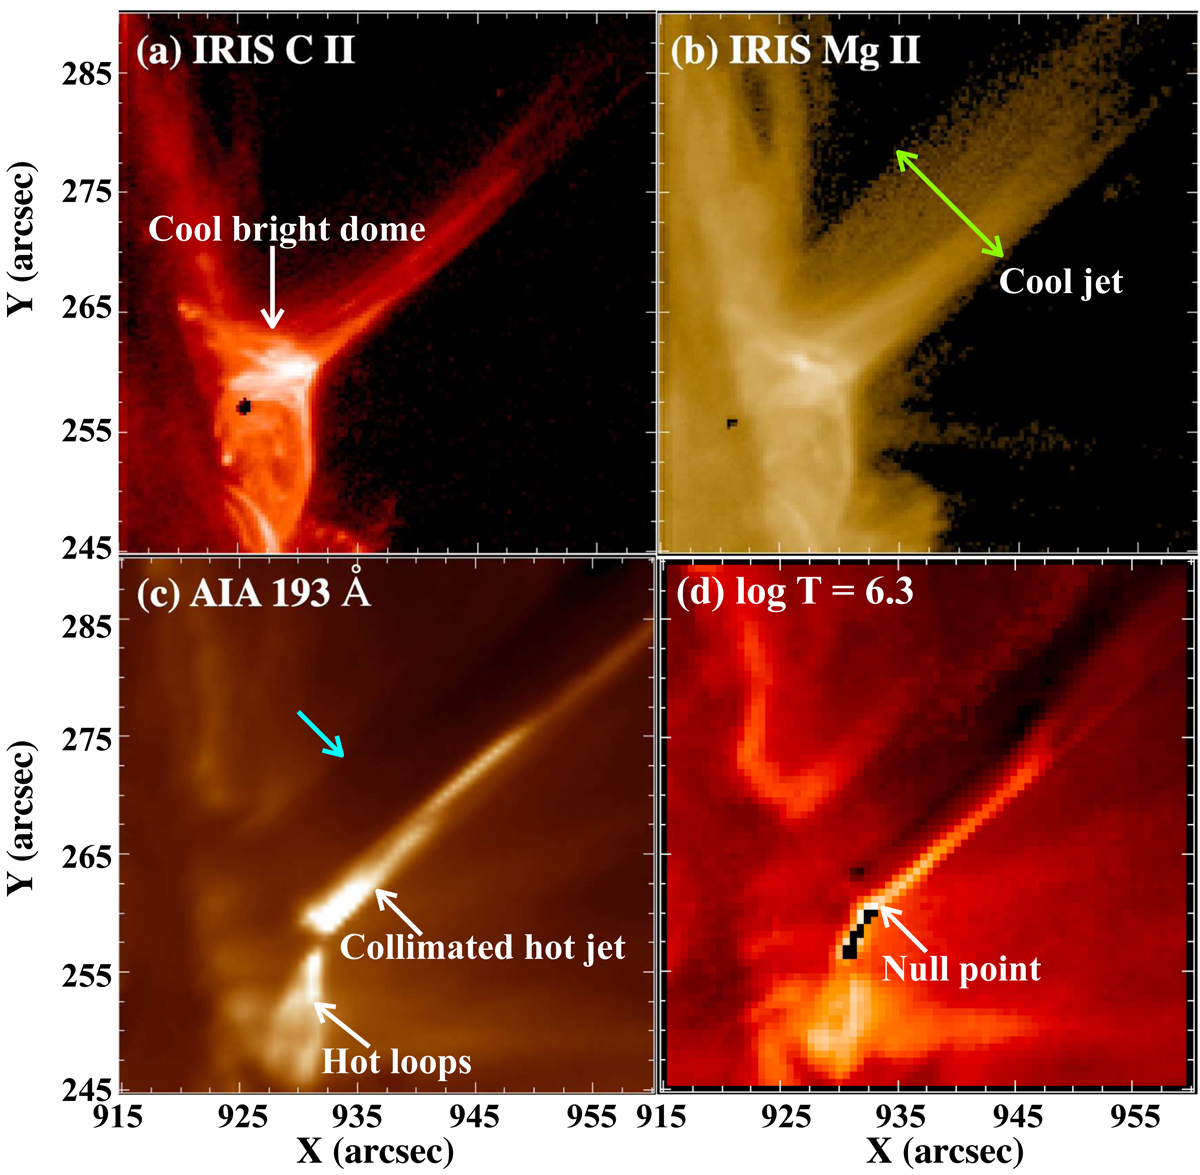
Example of jet2 at 11:45 UT observed with IRIS in panels a and b and AIA 193 Å in panel c. The cool bright dome on the northern side of the null-point is shown with a white arrow in panel a. We show the broad cool jet in panel b (green arrow), the collimated narrow hot jet with hot loops (white arrows) and the absorption area (cyan arrow) in panel c, and the null-point and the long bright CS is indicated by the white arrow in panel d. The black points are the saturated areas in panel d.
Current usage metrics show cumulative count of Article Views (full-text article views including HTML views, PDF and ePub downloads, according to the available data) and Abstracts Views on Vision4Press platform.
Data correspond to usage on the plateform after 2015. The current usage metrics is available 48-96 hours after online publication and is updated daily on week days.
Initial download of the metrics may take a while.