Open Access
Fig. 4.
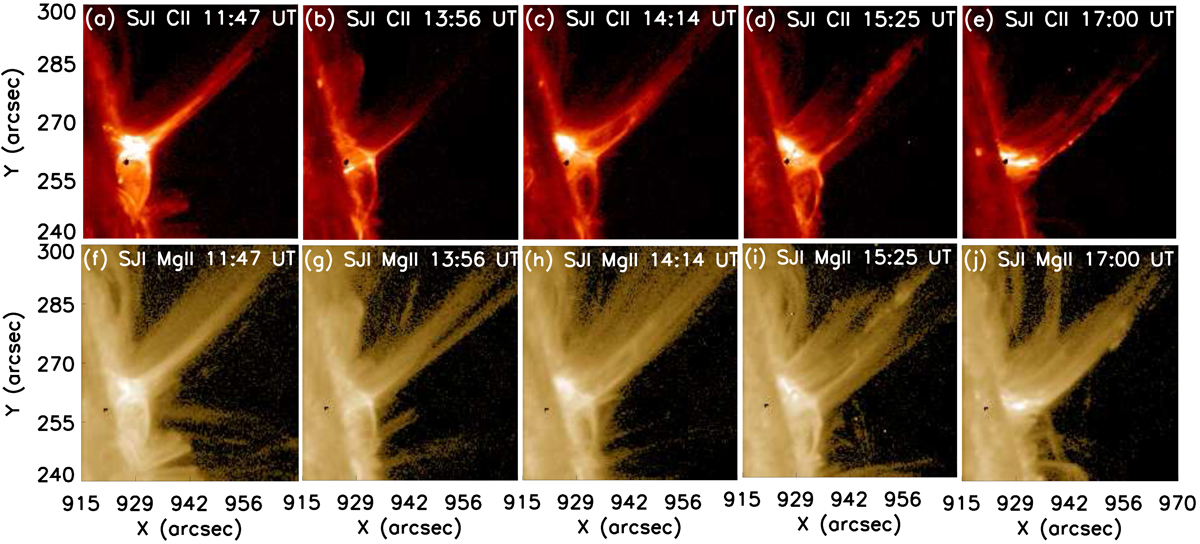
IRIS observed the active region from 11:05 UT to 17:58 UT. It covers five jets in our present analysis in CII (top) and MgII k (bottom) lines. The black points in the top panels are produced by extreme saturation, which we used for a better visibility of jets.
Current usage metrics show cumulative count of Article Views (full-text article views including HTML views, PDF and ePub downloads, according to the available data) and Abstracts Views on Vision4Press platform.
Data correspond to usage on the plateform after 2015. The current usage metrics is available 48-96 hours after online publication and is updated daily on week days.
Initial download of the metrics may take a while.