Fig. 11.
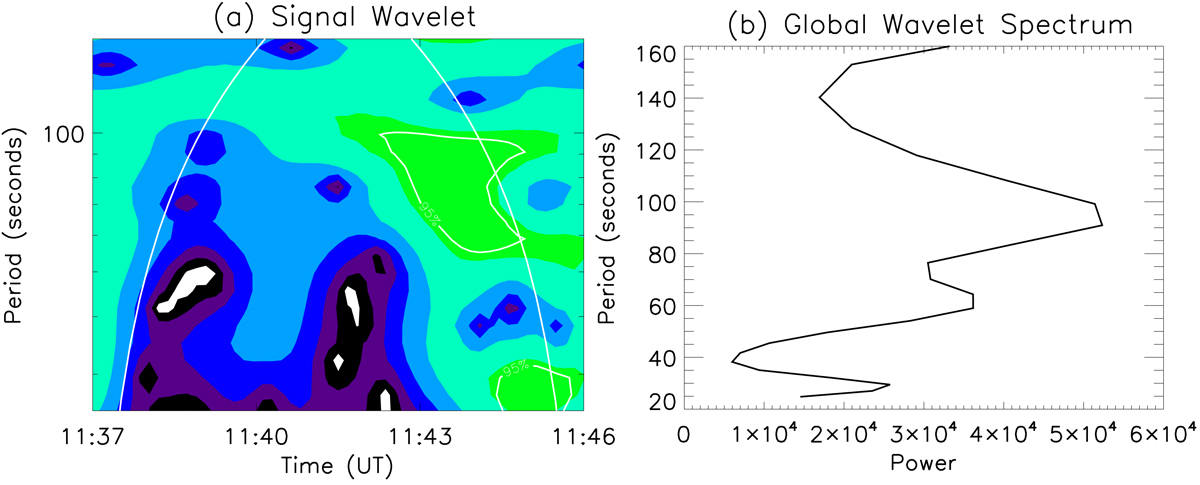
Panel a: example of a wavelet spectrum for the pre-jet intensity oscillations for jet2. The solid thick white contours (around the green surface) are the regions in which the value of the wavelet function is higher than 95% of its maximum value. The area outside the parabolic COI is the region where the wavelet analysis is not valid. Panel b: global wavelet spectra for the distribution of power over time. The highest peak corresponds to the time period of the pre-jet intensity oscillations, i.e. 1.5 min for jet2.
Current usage metrics show cumulative count of Article Views (full-text article views including HTML views, PDF and ePub downloads, according to the available data) and Abstracts Views on Vision4Press platform.
Data correspond to usage on the plateform after 2015. The current usage metrics is available 48-96 hours after online publication and is updated daily on week days.
Initial download of the metrics may take a while.