Fig. A.1.
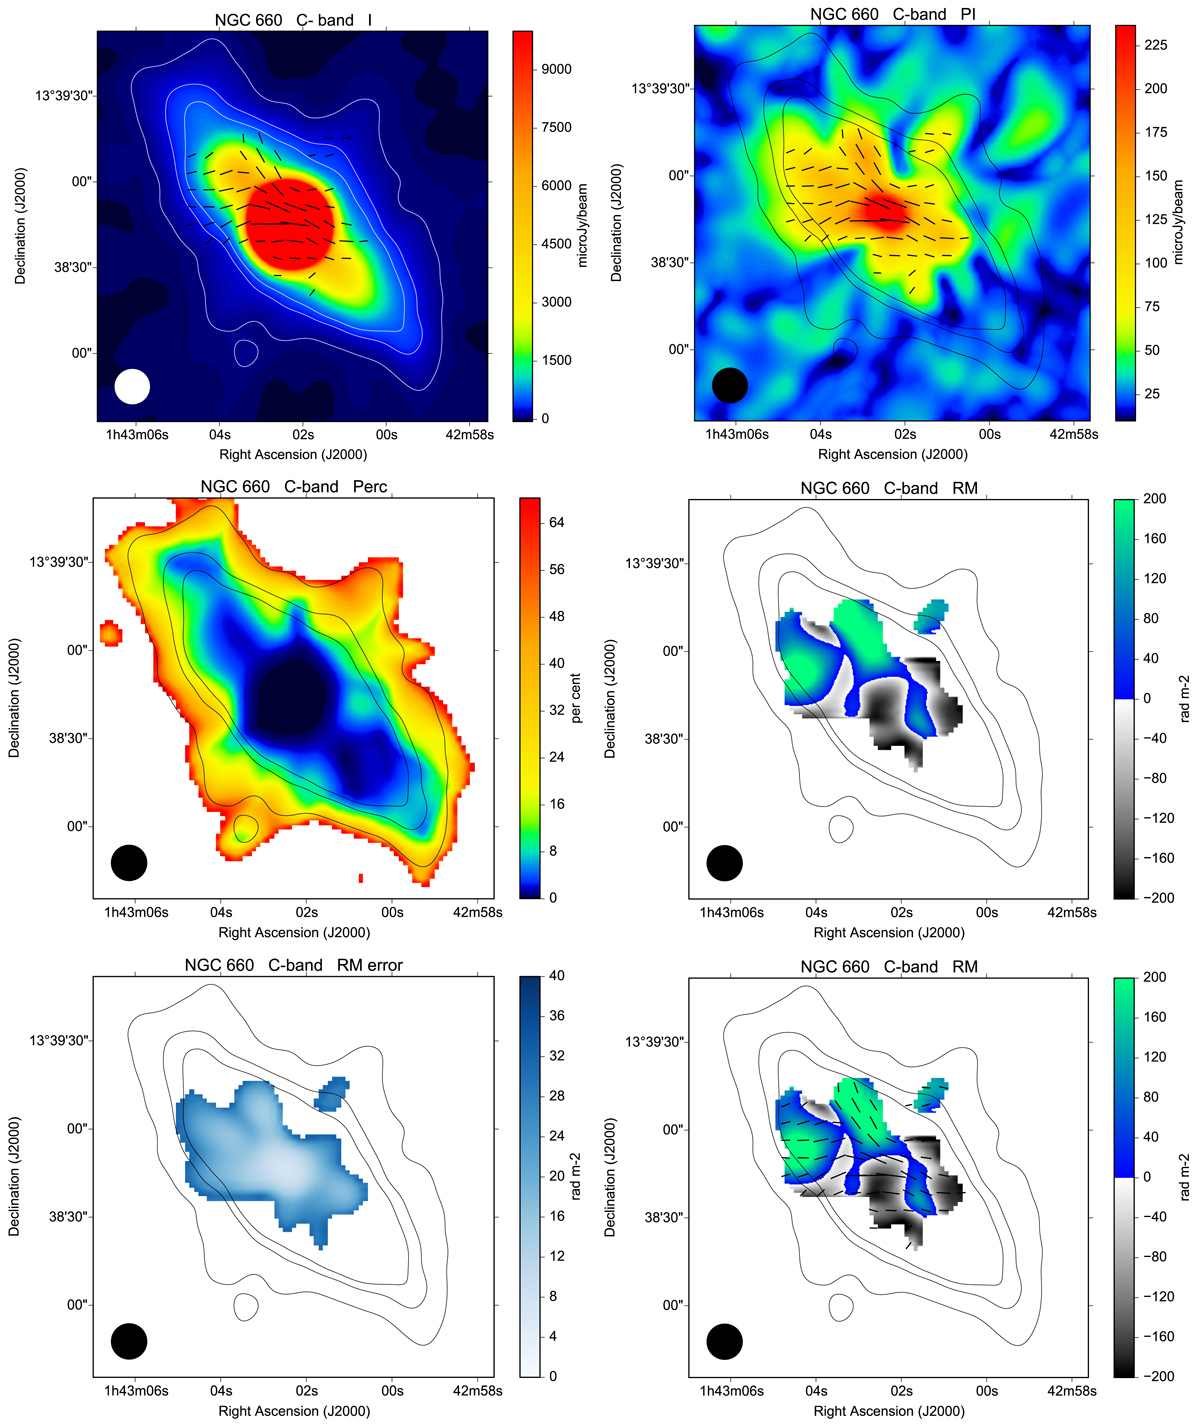
Polarization results for NGC 660 at C-band and 12″ HPBW, corresponding to 720 pc. The contour levels (TP) are 70, 210, and 350 μJy beam−1. The image of the TP map is cut at 10 000 μJy beam−1 in order to highlight the disk emission. The six panels show total intensity (TP, Stokes I) with contours at 5, 15, 25 σ rms and intrinsic polarization vectors (upper left, panel 1), PI with intrinsic polarization vectors, and the contours of TP as given in panel 1 (upper right, panel 2), percentage polarization (referred to as Perc) with TP contours of panel 1 (mid left, panel 3), RM with TP contours of panel 1 (mid right, panel 4), errors in RM with TP contours of panel 1 (lower left, panel 5), RM with intrinsic polarization vectors and TP contours of panel 1 (lower right, panel 6).
Current usage metrics show cumulative count of Article Views (full-text article views including HTML views, PDF and ePub downloads, according to the available data) and Abstracts Views on Vision4Press platform.
Data correspond to usage on the plateform after 2015. The current usage metrics is available 48-96 hours after online publication and is updated daily on week days.
Initial download of the metrics may take a while.