Fig. B.1.
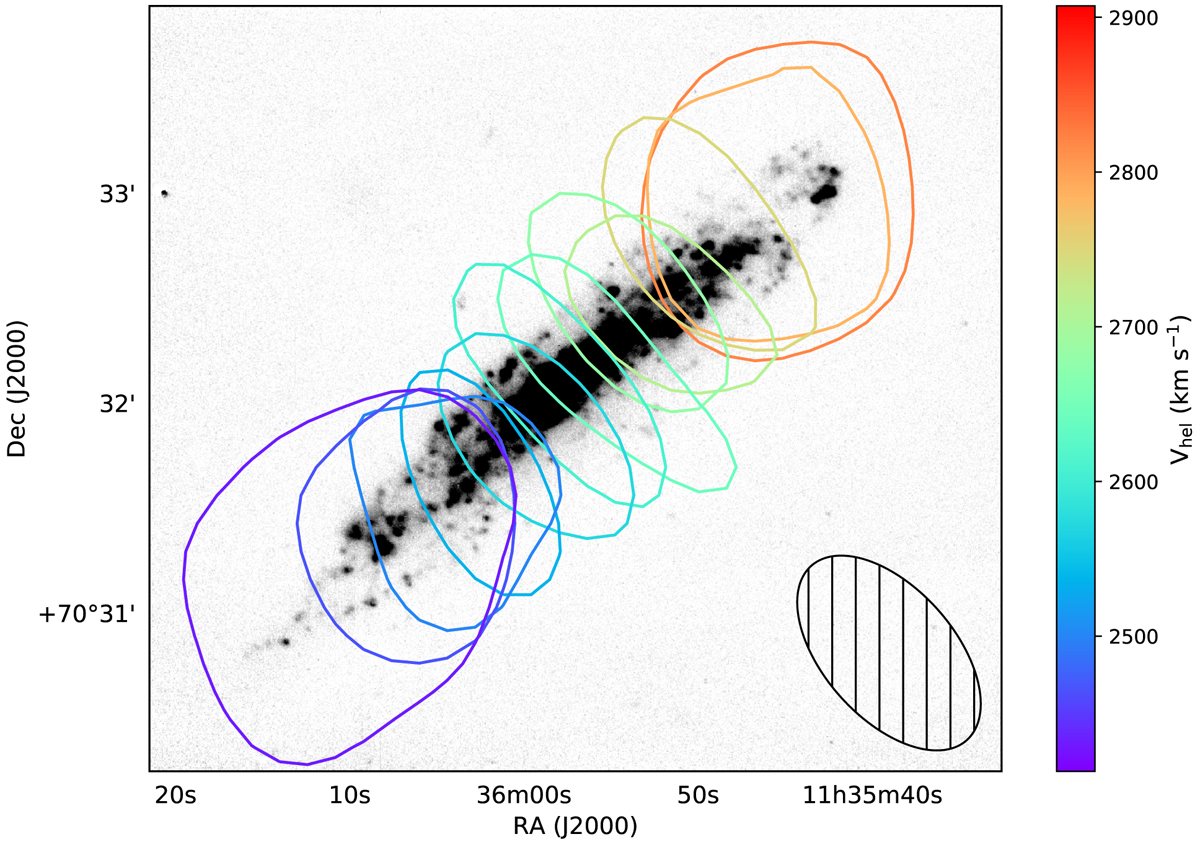
HI contour map of NGC3735 on top of its grayscale Hα map (Vargas et al. 2019). The contours are plotted at the 3 mJy beam−1 level, from every even channel in the HI cube, such that purple-blue colours correspond to the approaching side and orange-red colours correspond to the receding side. The velocity range is about 2380–3000 km s−1. The synthesized beam is shown in the bottom right, and is 66.9 × 37.4 arcsec, with PA = 41.8 deg.
Current usage metrics show cumulative count of Article Views (full-text article views including HTML views, PDF and ePub downloads, according to the available data) and Abstracts Views on Vision4Press platform.
Data correspond to usage on the plateform after 2015. The current usage metrics is available 48-96 hours after online publication and is updated daily on week days.
Initial download of the metrics may take a while.