Open Access
Fig. 3.
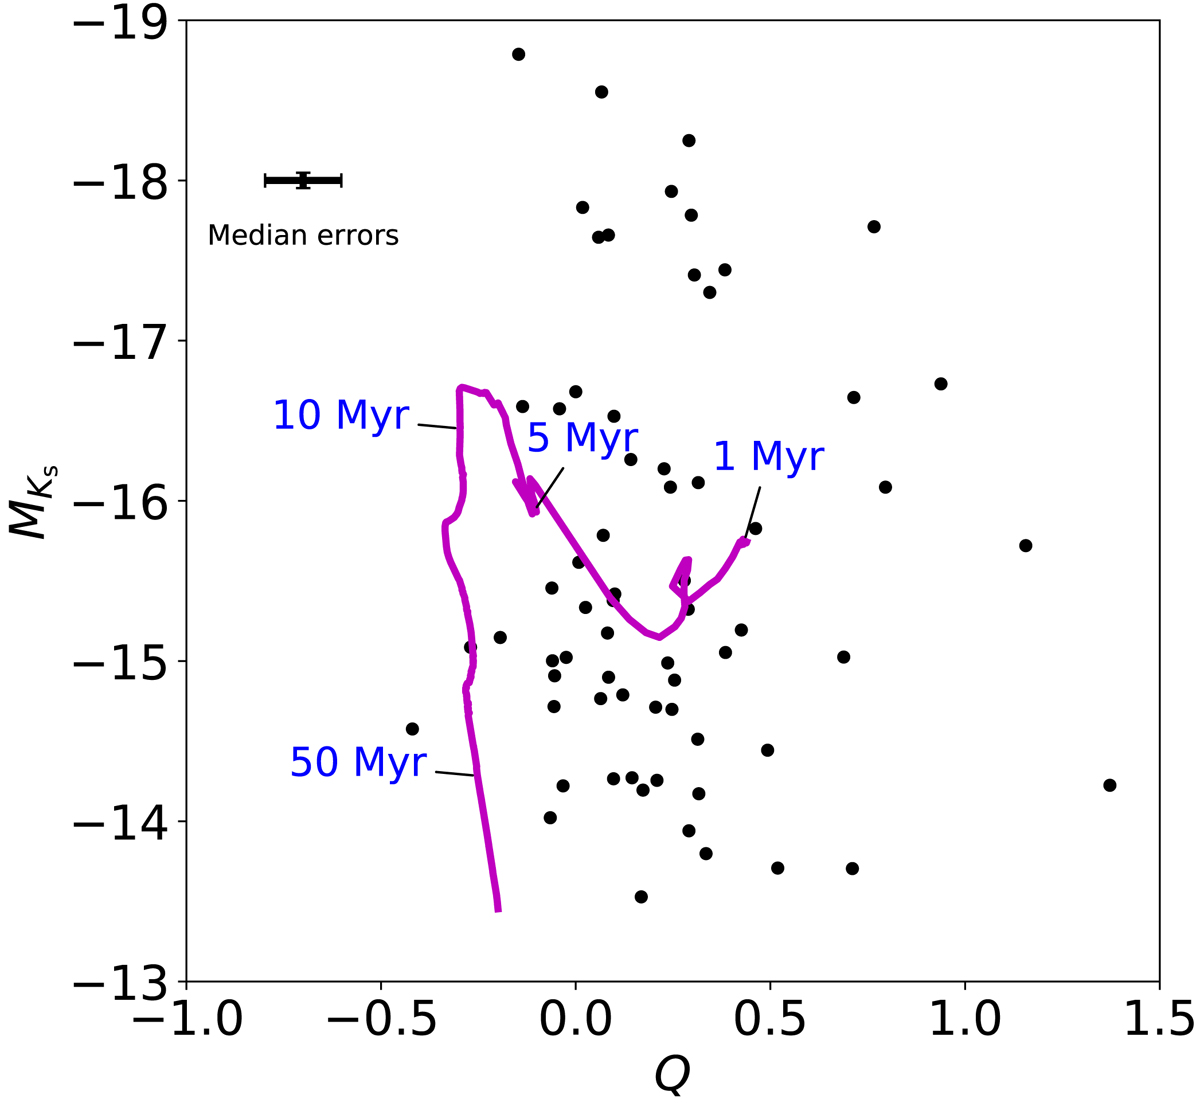
Color–magnitude Q versus Ks diagram using the absolute Ks magnitude and the Q index, which in principle is not affected by the extinction. The same theoretical stellar evolution track as in Fig. 2 is shown. The black cross represents the median errors of the cluster colors and magnitudes.
Current usage metrics show cumulative count of Article Views (full-text article views including HTML views, PDF and ePub downloads, according to the available data) and Abstracts Views on Vision4Press platform.
Data correspond to usage on the plateform after 2015. The current usage metrics is available 48-96 hours after online publication and is updated daily on week days.
Initial download of the metrics may take a while.