Fig. 2.
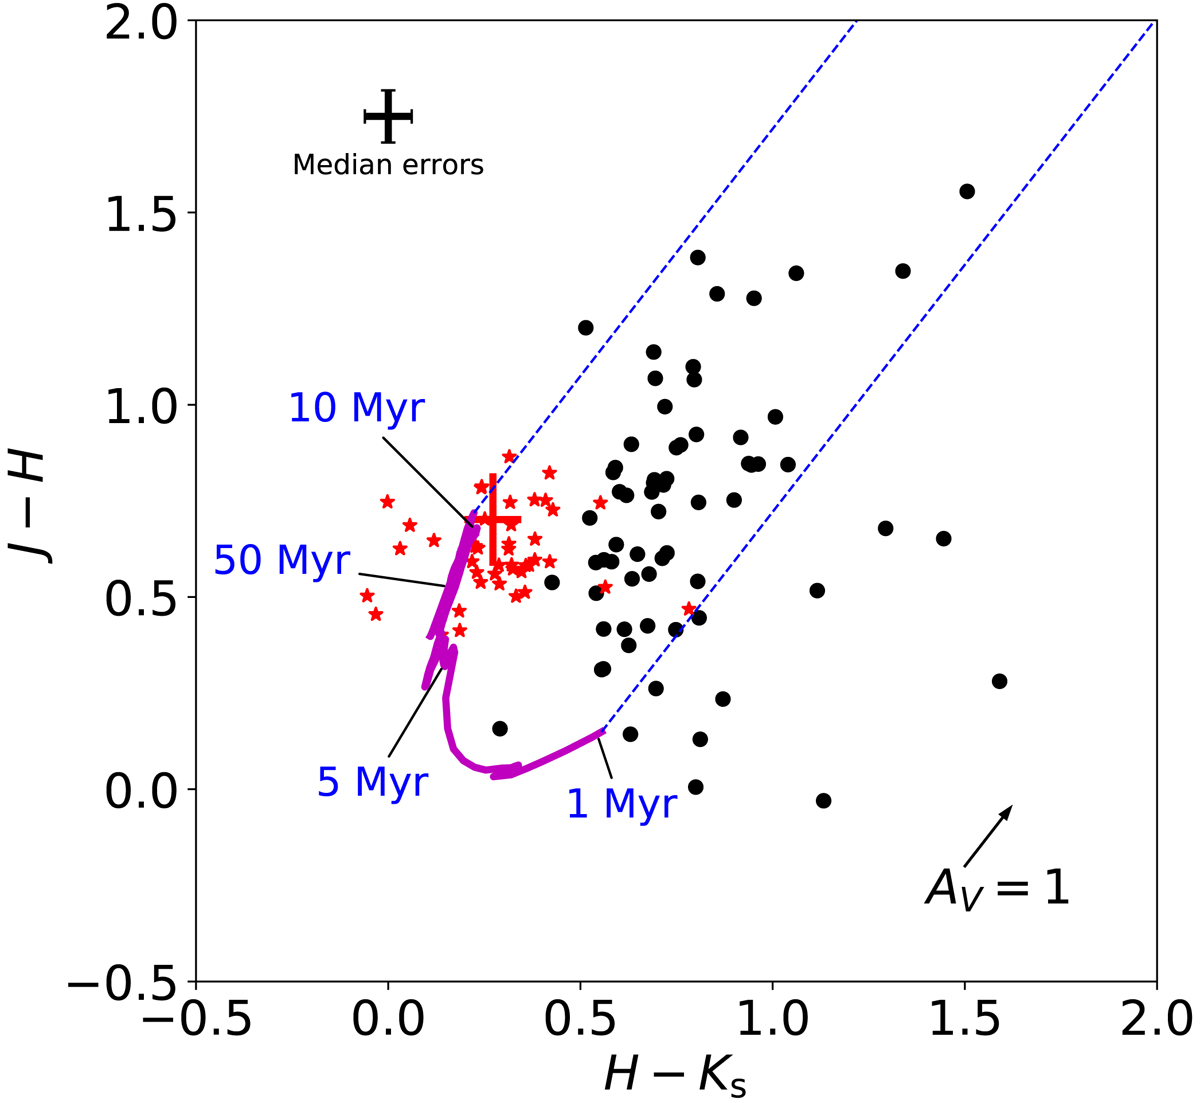
Color–color diagram (J − H) versus (H − Ks) for the selected sample of SSCs (black dots). The theoretical stellar evolution track given by SB99 is shown for solar metallicity as the solid magenta line. The reddening vector corresponding to AV = 1 is shown. The red stars are the sources detected in the control field, and the cross corresponds to the average color indices of the sample of 100 galaxies from the 2MASS survey, studied by Jarrett et al. (2003), with the length of the arms being equal to the standard deviations of those indices. The black cross represents the median errors of the cluster colors.
Current usage metrics show cumulative count of Article Views (full-text article views including HTML views, PDF and ePub downloads, according to the available data) and Abstracts Views on Vision4Press platform.
Data correspond to usage on the plateform after 2015. The current usage metrics is available 48-96 hours after online publication and is updated daily on week days.
Initial download of the metrics may take a while.