Open Access
Fig. 14.
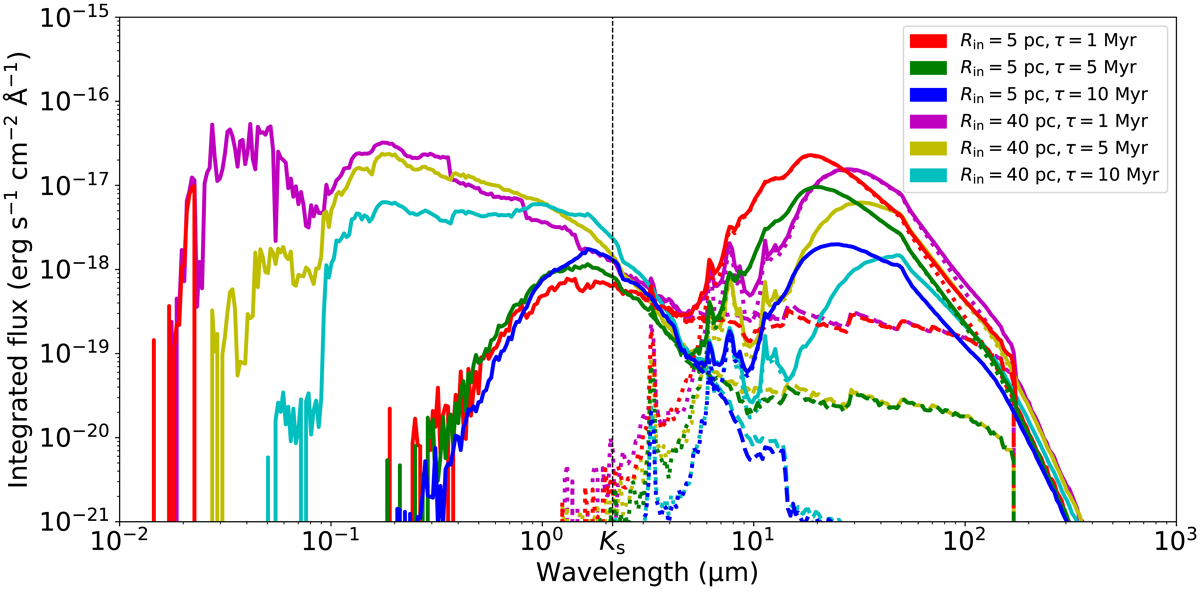
Spectral energy distributions obtained with MontAGN for various sets of age τ and inner radius Rin of the dust envelope. The thick lines represent the total flux, the dotted lines indicate the dust emission, and the dashed lines indicate the stellar emission. The position of the Ks-band is denoted.
Current usage metrics show cumulative count of Article Views (full-text article views including HTML views, PDF and ePub downloads, according to the available data) and Abstracts Views on Vision4Press platform.
Data correspond to usage on the plateform after 2015. The current usage metrics is available 48-96 hours after online publication and is updated daily on week days.
Initial download of the metrics may take a while.