Fig. 9.
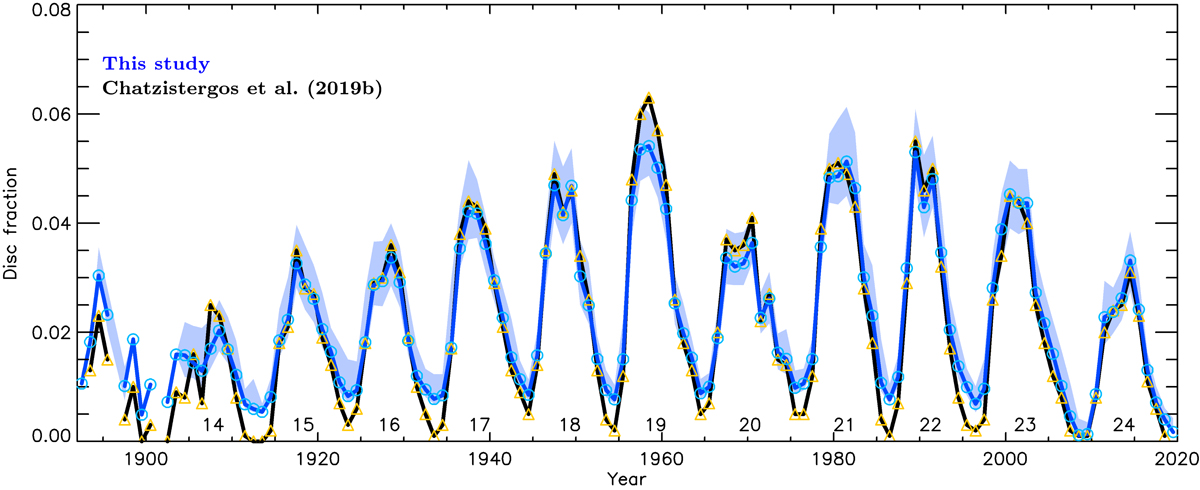
Composite of plage areas in disc fraction derived in this study (blue line and ciel circles) along with the composite by Chatzistergos et al. (2019b, black line and yellow triangles). Shown are annual median values (solid lines and symbols) along with the asymmetric 1σ interval (shaded surfaces). The solar cycle numbers are given below the curves.
Current usage metrics show cumulative count of Article Views (full-text article views including HTML views, PDF and ePub downloads, according to the available data) and Abstracts Views on Vision4Press platform.
Data correspond to usage on the plateform after 2015. The current usage metrics is available 48-96 hours after online publication and is updated daily on week days.
Initial download of the metrics may take a while.