Fig. 8.
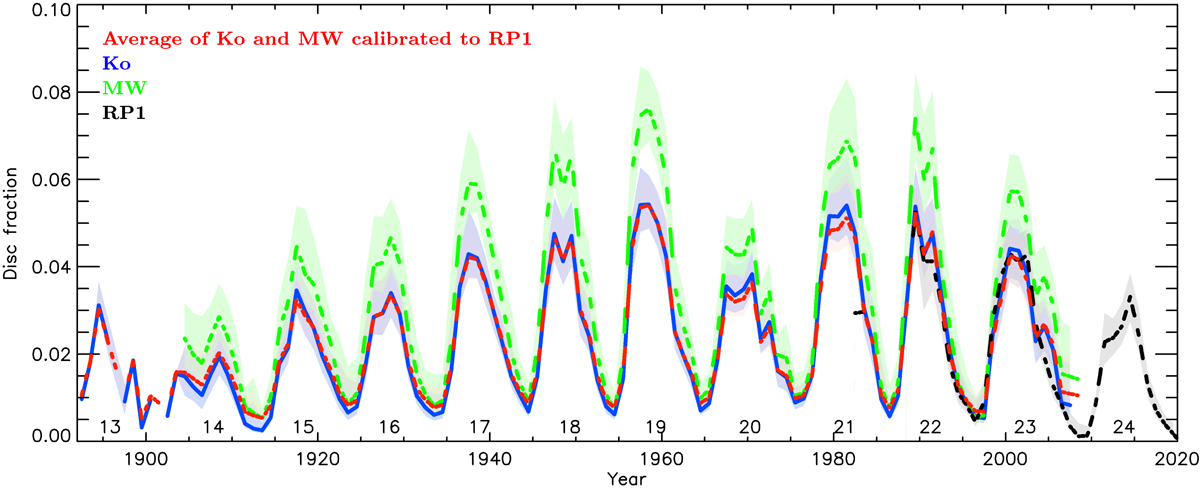
Backbone series of plage areas by using as reference the series from RP1 (dashed black), Ko (solid blue), MW (dashed green), and the average backbone of the MW and Ko series after their cross-calibration to the RP1 one (dashed red). Shown are annual median values (lines) along with the asymmetric 1σ interval (shaded surfaces). The solar cycle numbers are given below the curves.
Current usage metrics show cumulative count of Article Views (full-text article views including HTML views, PDF and ePub downloads, according to the available data) and Abstracts Views on Vision4Press platform.
Data correspond to usage on the plateform after 2015. The current usage metrics is available 48-96 hours after online publication and is updated daily on week days.
Initial download of the metrics may take a while.