Fig. 7.
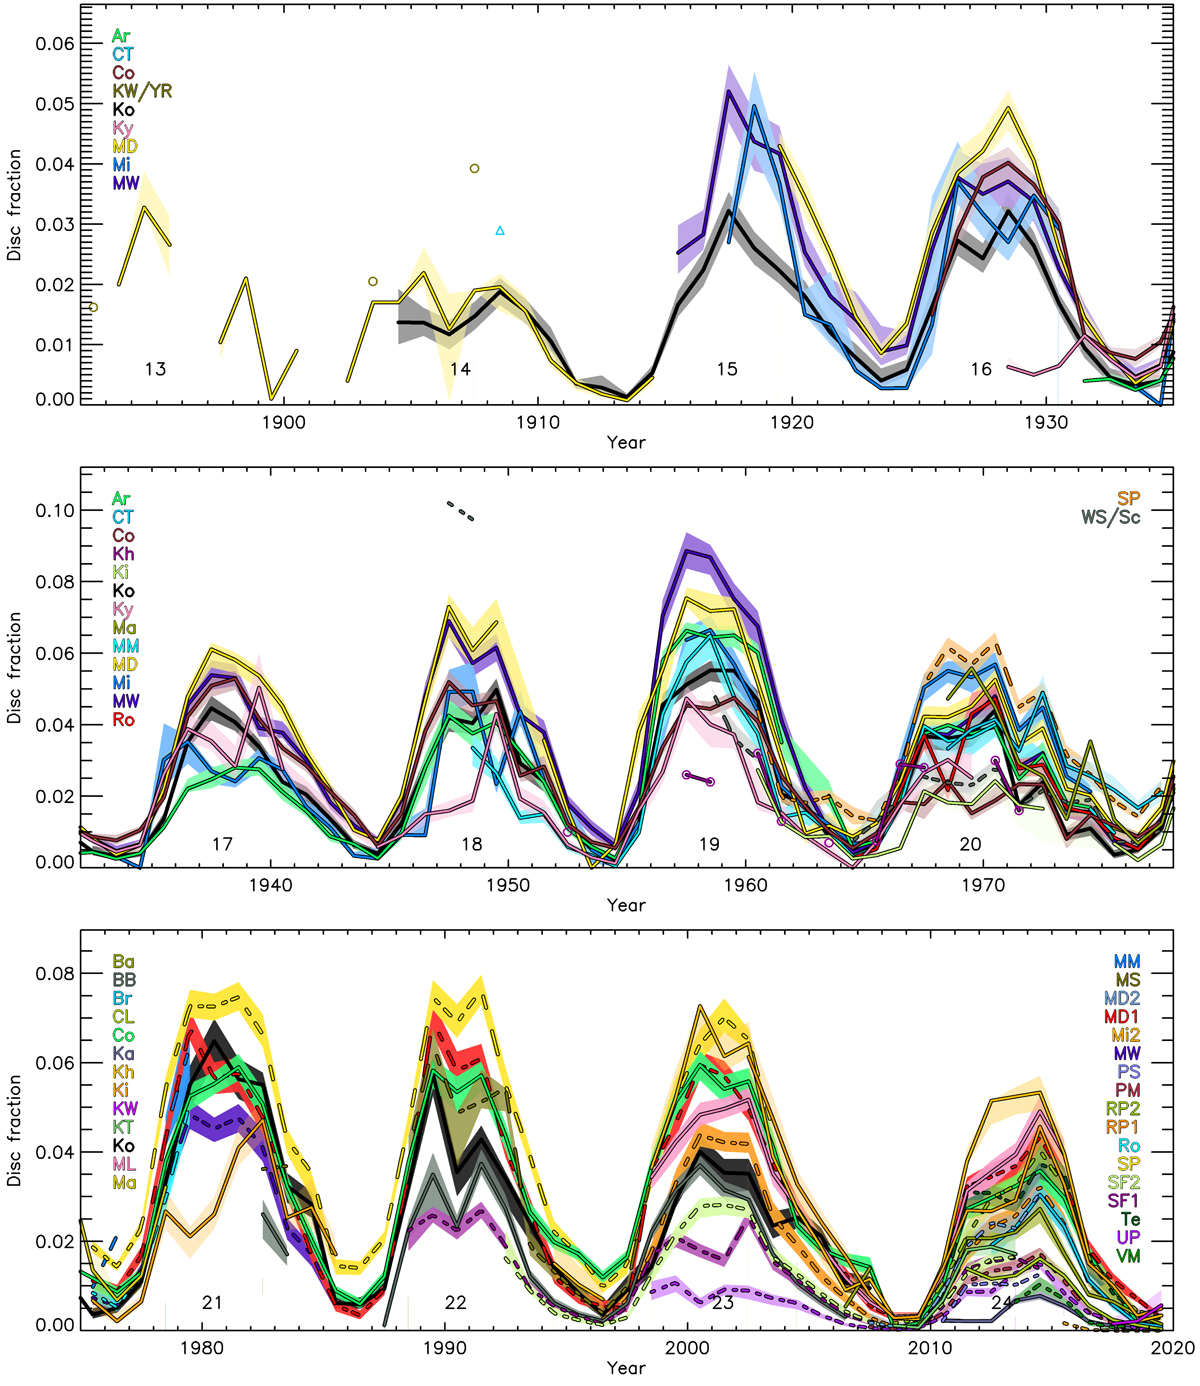
Evolution of plage areas given as fraction of the solar disc derived from analysis of the 38 datasets considered in this study. Shown are annual median values (lines) along with the asymmetric 1σ interval (shaded surfaces) for each dataset as specified in the legend. To improve visibility, the archives listed in the legend in the right side of the plot are represented by dashed lines. Due to the scarcity of observations, the plage areas derived from the Ke/YR and CT observations in the top panel, as well as the Kh in the middle panel are represented by circles, triangles, and circles, respectively. The conventional solar cycle (SC) numbers are given below the curves.
Current usage metrics show cumulative count of Article Views (full-text article views including HTML views, PDF and ePub downloads, according to the available data) and Abstracts Views on Vision4Press platform.
Data correspond to usage on the plateform after 2015. The current usage metrics is available 48-96 hours after online publication and is updated daily on week days.
Initial download of the metrics may take a while.