Fig. 2.
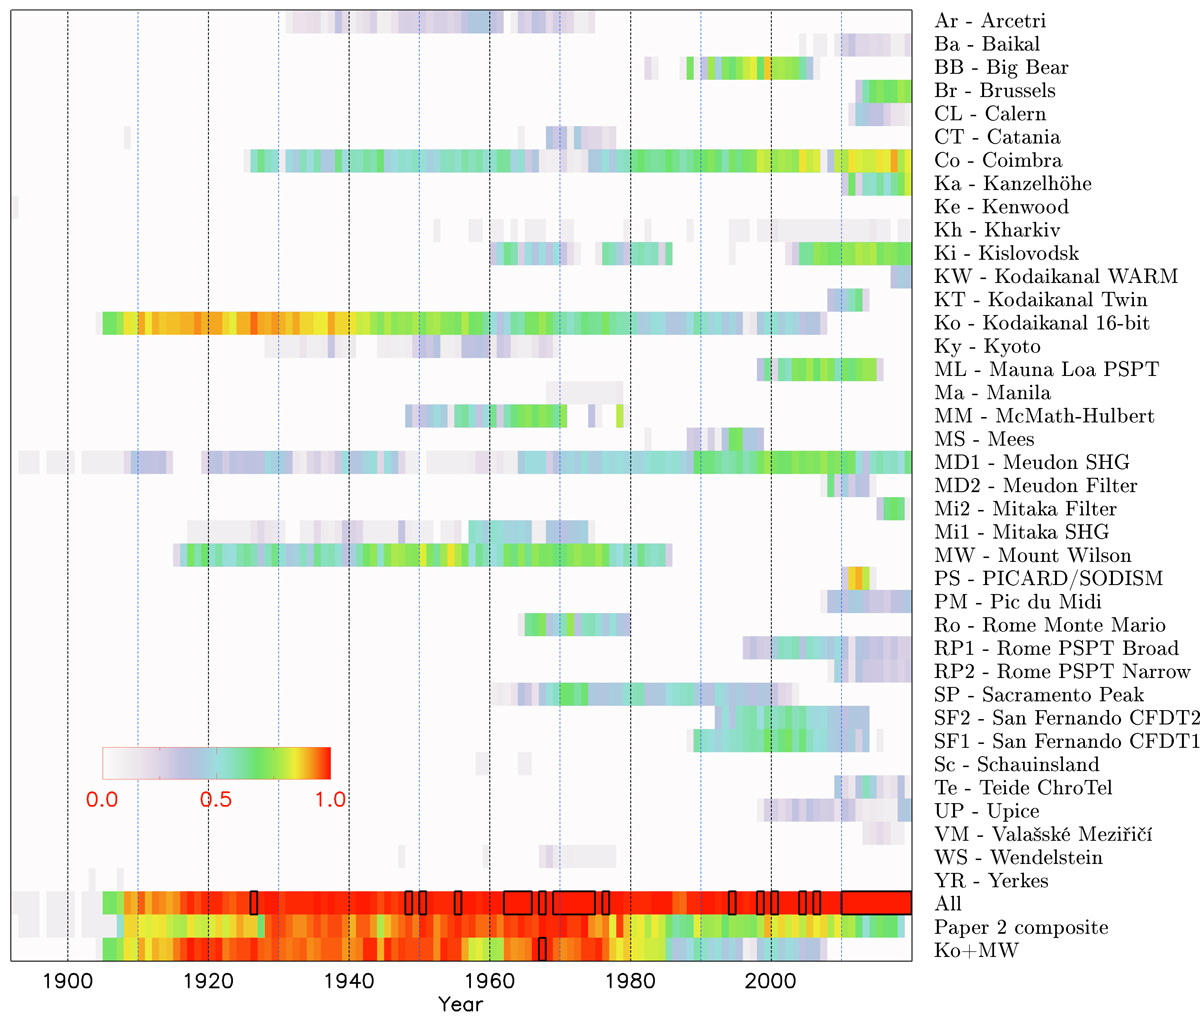
Annual coverage of the various Ca II K archives analysed in this study, except from those taken off-band (see Sect. 2 for details). Also shown is the annual coverage of all the archives combined, the one for the Chatzistergos et al. (2019b, Paper II) composite series, and the annual coverage when only Ko and MW are considered. The annual coverage is colour-coded as shown by the colour bar plotted in the bottom left corner of the panel. Years with full coverage are outlined with black rectangles.
Current usage metrics show cumulative count of Article Views (full-text article views including HTML views, PDF and ePub downloads, according to the available data) and Abstracts Views on Vision4Press platform.
Data correspond to usage on the plateform after 2015. The current usage metrics is available 48-96 hours after online publication and is updated daily on week days.
Initial download of the metrics may take a while.