Fig. A.1.
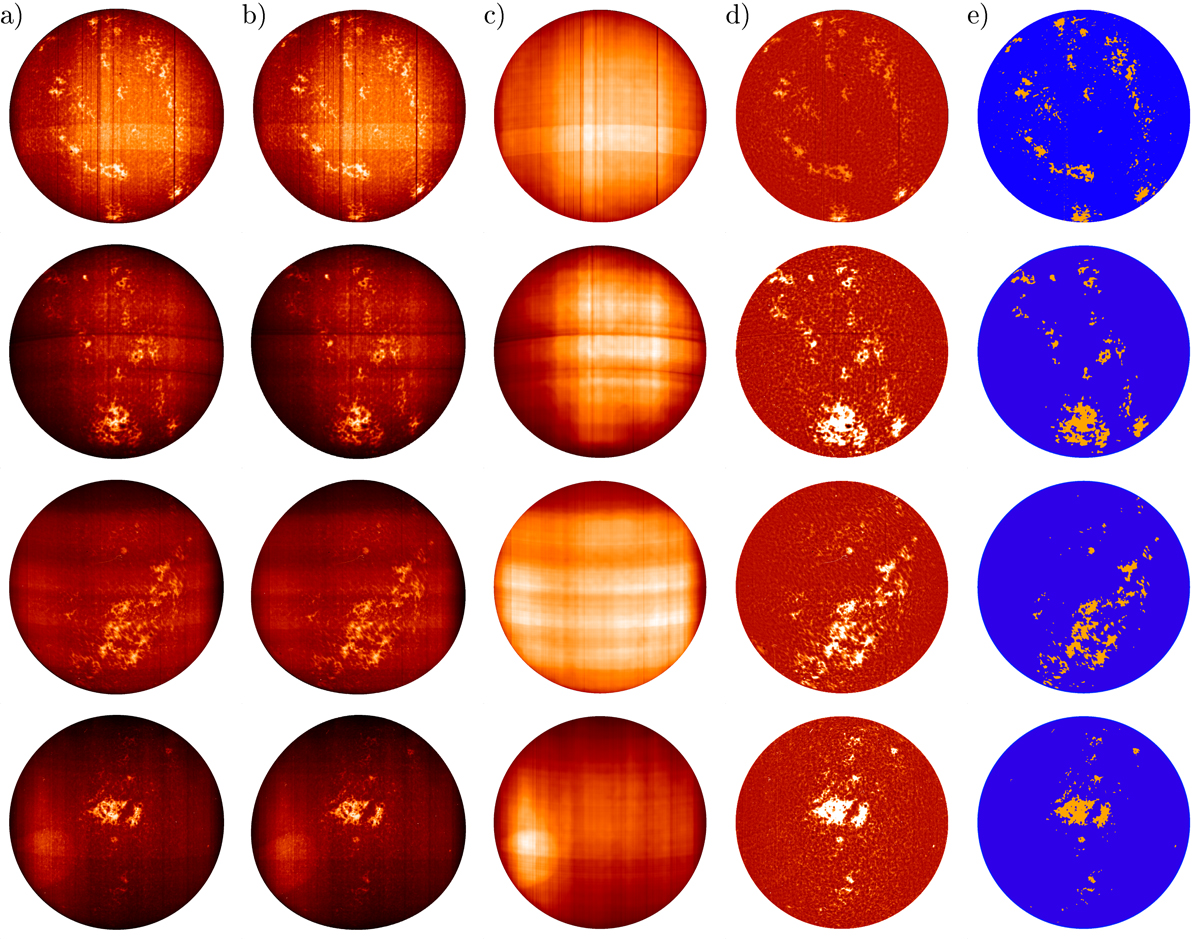
Examples of processing steps applied on Ky observations taken on 22/10/1937 (first row), 28/10/1939 (second row), 21/01/1959 (third row), and 30/04/1961 (fourth row). Columns are: original raw density image (a), density image resampled to straighten the arcs (b), computed background of the original image (c), photometrically calibrated and limb-darkening-compensated image (d), and segmentation mask (e). The raw density images and the backgrounds are shown to the entire range of values within the disc, the calibrated images are shown in the range [−0.5, 0.5], while the masks show plage regions in orange and QS and network regions in blue. The images are not compensated for ephemeris.
Current usage metrics show cumulative count of Article Views (full-text article views including HTML views, PDF and ePub downloads, according to the available data) and Abstracts Views on Vision4Press platform.
Data correspond to usage on the plateform after 2015. The current usage metrics is available 48-96 hours after online publication and is updated daily on week days.
Initial download of the metrics may take a while.