Fig. 15.
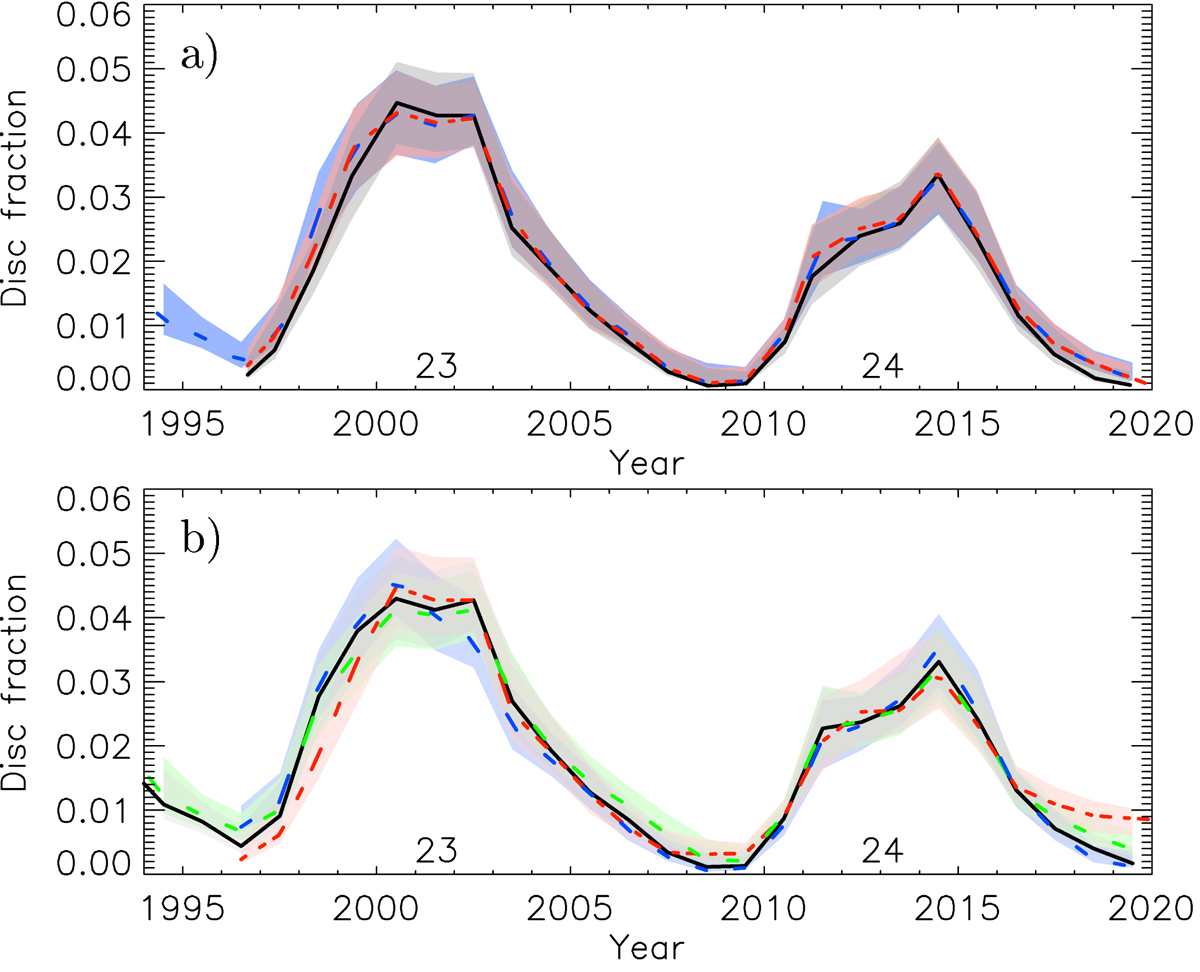
Top: RP1 plage area series (solid black) plotted along with the RP1 backbone composite series used in our plage area composite (dashed blue) and RP1 backbone composite series keeping only the days common with the RP1 individual series (dashed red). Bottom: RP1 backbone composite series when varying the included individual datasets based on their bandwidth. The different curves show the RP1 backbone composite by keeping Ba, Co, Kh, RP2, SF1, SF2, Te, Up (dashed green), Br, ML, BB (dashed blue) and Ka, PM, VM (dashed red). The RP1 backbone series used for our composite is shown in solid black. Depicted are annual median values (solid lines) along with the 1σ asymmetric intervals (shaded surfaces). The SC numbers are given below the curves.
Current usage metrics show cumulative count of Article Views (full-text article views including HTML views, PDF and ePub downloads, according to the available data) and Abstracts Views on Vision4Press platform.
Data correspond to usage on the plateform after 2015. The current usage metrics is available 48-96 hours after online publication and is updated daily on week days.
Initial download of the metrics may take a while.