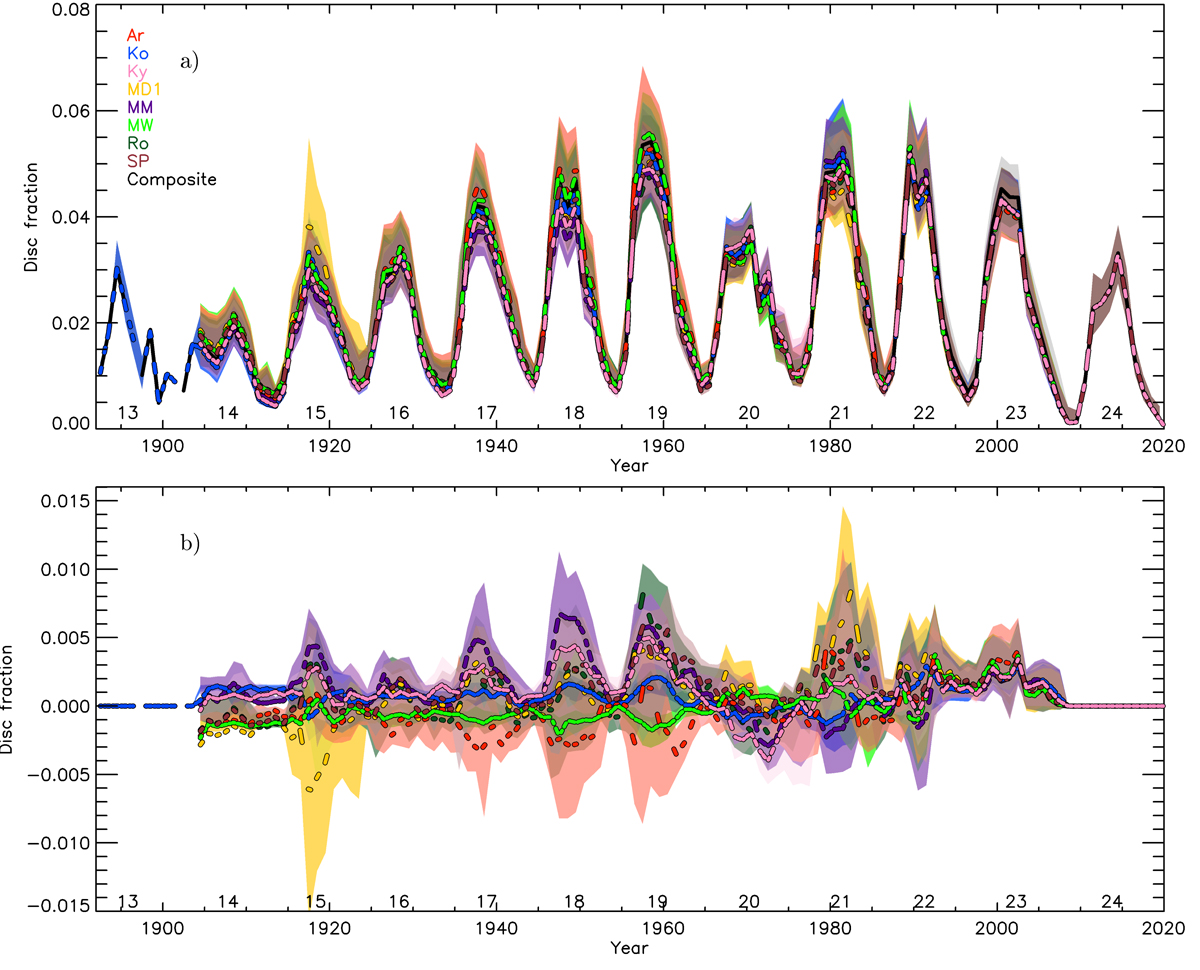
Fig. 14.
Plage area composites (a) and their differences in comparison to our main composite series (b) produced when the historical backbone series was computed with various individual historical datasets as the backbone reference instead of using the average of the calibrated Ko and MW ones to the RP1 one. RP1 is always taken as the overall reference for all composite series. The datasets used as backbones are those from Ar (red), Ko (blue), Ky (pink), MD1 (orange), MM (purple), MW (green), Ro (dark green), and SP (brown) sites. The composite plage area series derived in this study is also displayed in black. Shown are the annual median values (lines) of the final plage area composites along with the asymmetric 1σ interval (shaded surfaces). The numbers below the curves denote the conventional SC numbering.
Current usage metrics show cumulative count of Article Views (full-text article views including HTML views, PDF and ePub downloads, according to the available data) and Abstracts Views on Vision4Press platform.
Data correspond to usage on the plateform after 2015. The current usage metrics is available 48-96 hours after online publication and is updated daily on week days.
Initial download of the metrics may take a while.