Fig. 13.
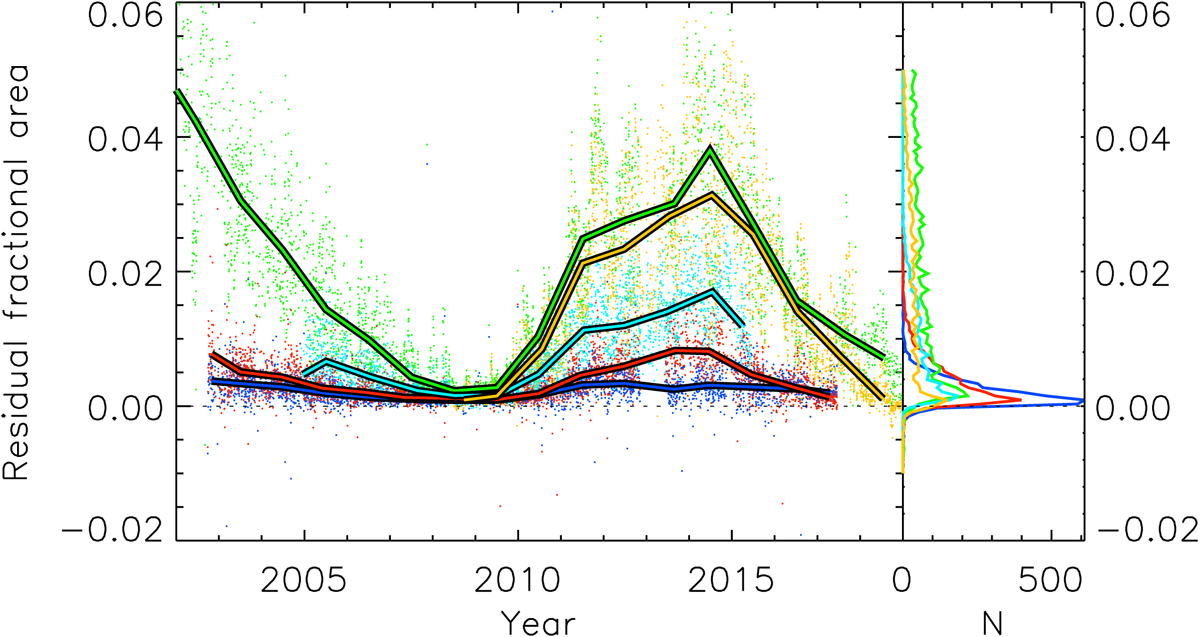
Left: difference of fractional plage area between those derived from centred and off-centred Ca II K observations as a function of time. The differences shown are for the Co-CoW (orange), MD1-MDW (green), MD1-MDV (blue), MD1-MDR (red), ML-MLW (ciel). Dots show daily values, while the solid lines show annual median values. The dotted horizontal line denotes a difference of 0. Right: distributions of the differences.
Current usage metrics show cumulative count of Article Views (full-text article views including HTML views, PDF and ePub downloads, according to the available data) and Abstracts Views on Vision4Press platform.
Data correspond to usage on the plateform after 2015. The current usage metrics is available 48-96 hours after online publication and is updated daily on week days.
Initial download of the metrics may take a while.