Fig. 12.
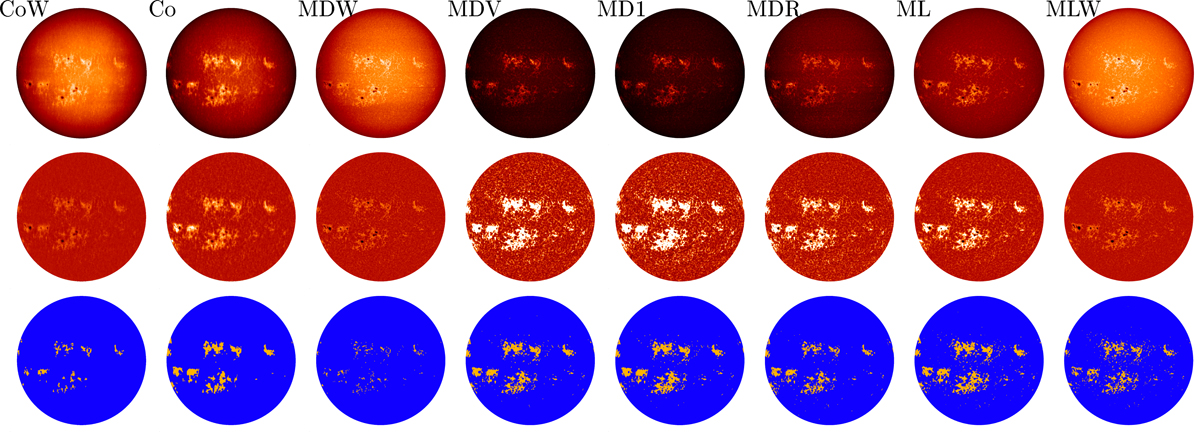
Examples of observations taken on the same date (04 July 2014) from the various datasets analysed in this study with images not centred at the core of the Ca II K line along with those from the same observatories centred at the core of the Ca II K line. Shown are images from the CoW, Co, MDW, MDV, MD1, MDR, ML, MLW datasets after the preprocessing to identify the disc and re-sample them to account for the disc ellipticity (top row), after CLV-compensation (middle row), and after the identification of plage (bottom row). The images have been aligned to show the solar north pole at the top. The raw images are shown to their entire range of values, the CLV-compensated images are shown in the range [−0.5,0.5], while in the masks, the plage regions are shown in orange and the quiet Sun and network regions in blue. We stress that the same threshold was used for all datasets to identify the plage regions, which is why the different datasets seem to provide rather different ranges of plage coverage.
Current usage metrics show cumulative count of Article Views (full-text article views including HTML views, PDF and ePub downloads, according to the available data) and Abstracts Views on Vision4Press platform.
Data correspond to usage on the plateform after 2015. The current usage metrics is available 48-96 hours after online publication and is updated daily on week days.
Initial download of the metrics may take a while.