Fig. 11.
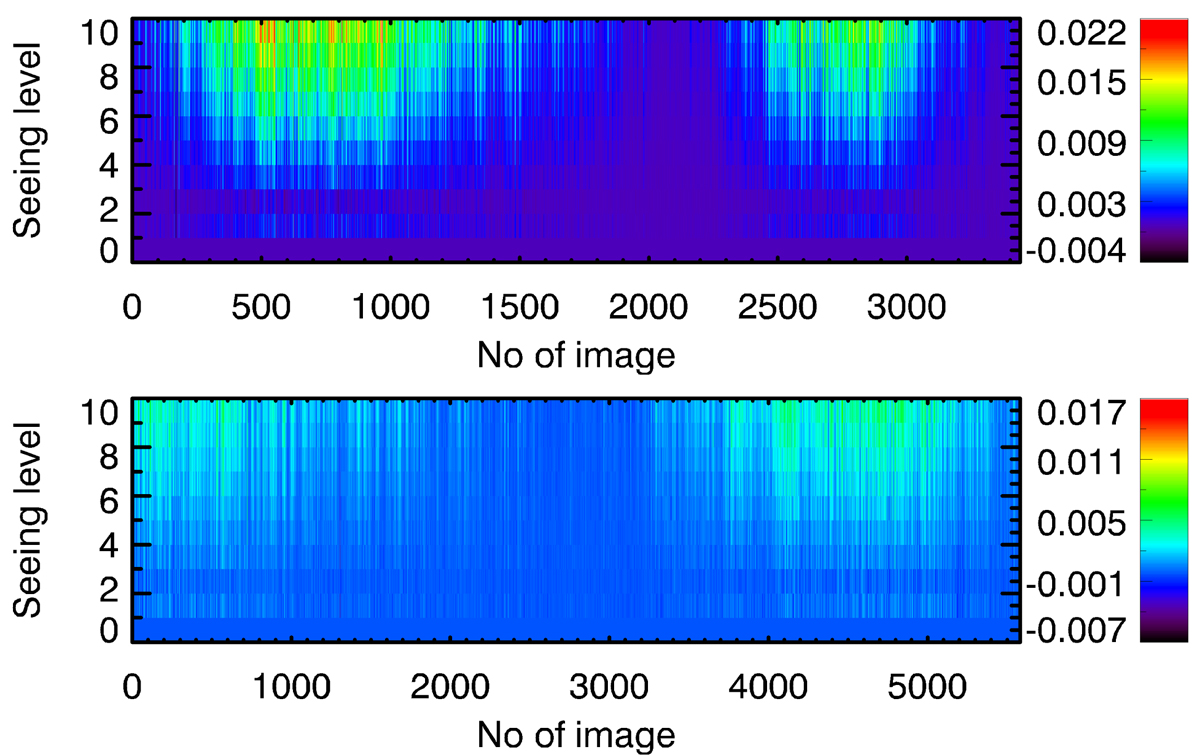
Colour-coded difference in fractional plage areas derived from RP1 (top) and MD1 (bottom) images downgraded to simulate effects of seeing and those derived from the original RP1 and MD1 images, respectively. The MD1 data used here are only those taken with a CCD camera between 2002 and 2017. Each row (column) of boxes shows results derived from a given observation (width of the smoothing Gaussian function). See Sect. 4 for details.
Current usage metrics show cumulative count of Article Views (full-text article views including HTML views, PDF and ePub downloads, according to the available data) and Abstracts Views on Vision4Press platform.
Data correspond to usage on the plateform after 2015. The current usage metrics is available 48-96 hours after online publication and is updated daily on week days.
Initial download of the metrics may take a while.