Fig. 10.
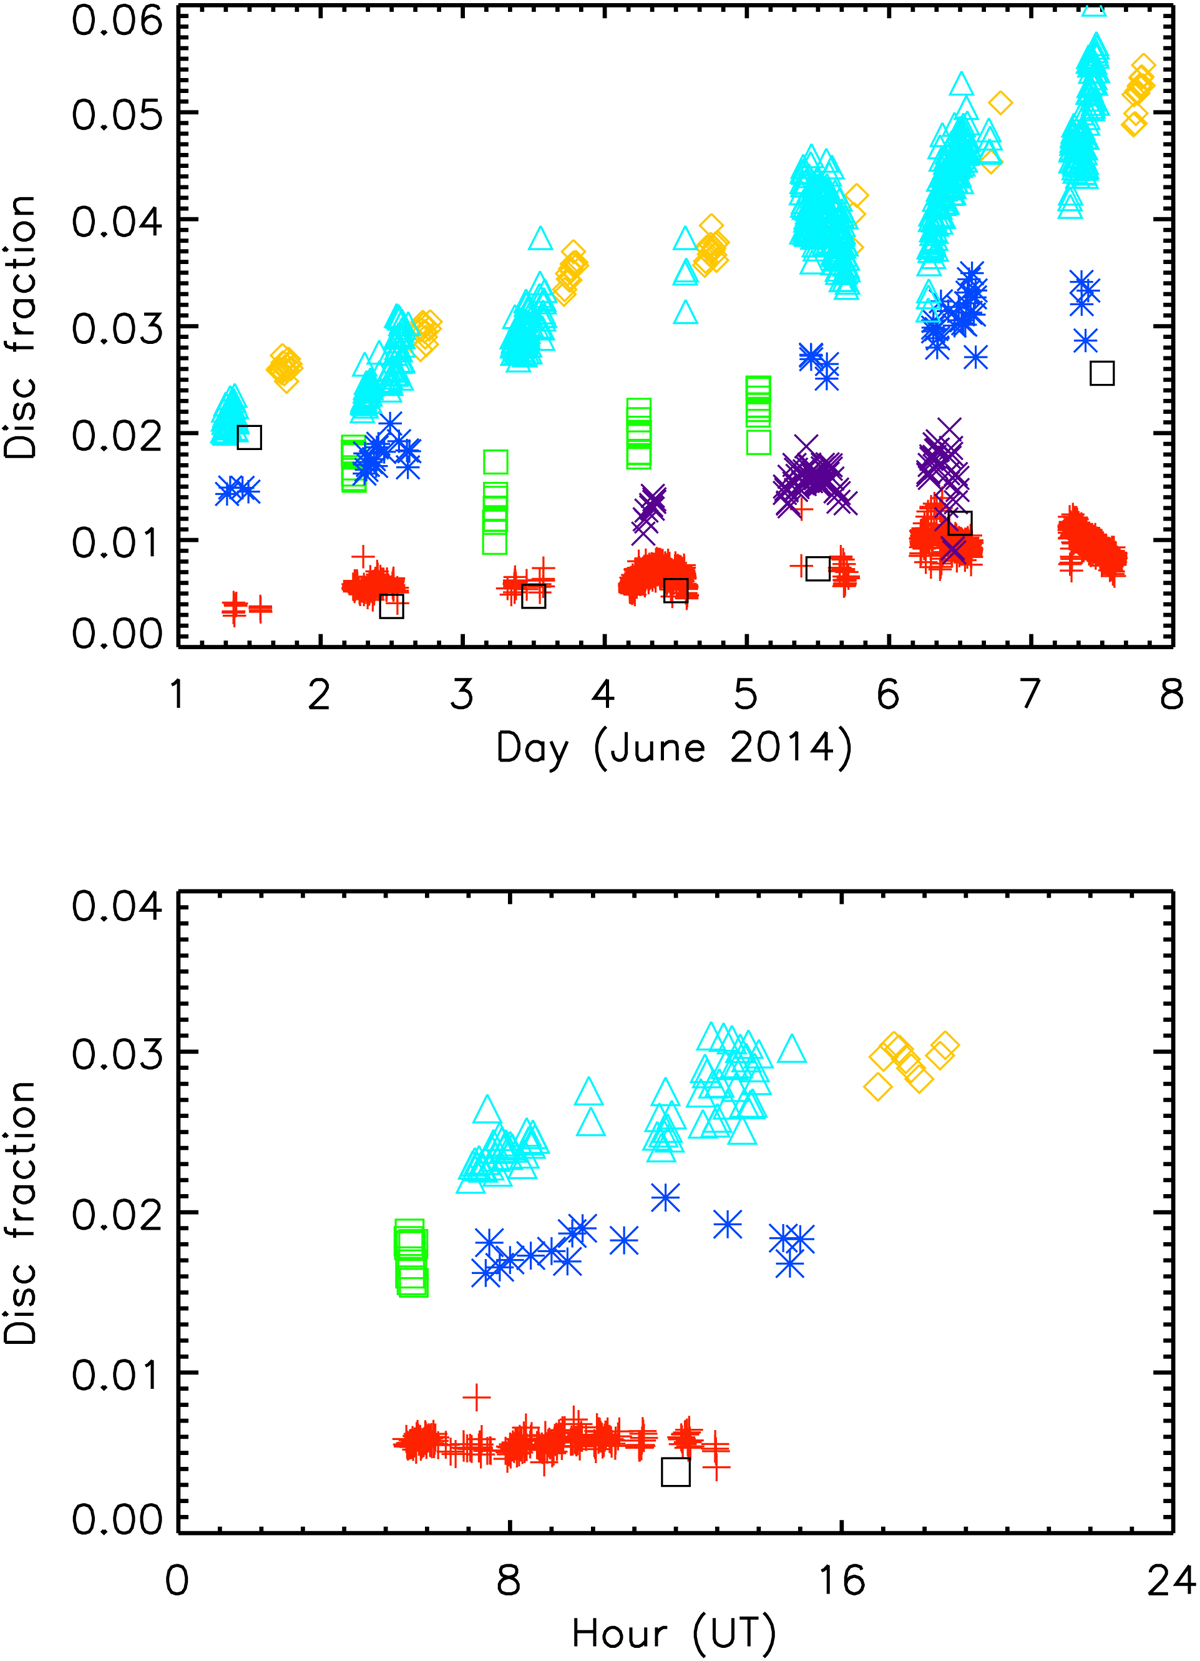
Plage areas in disc fraction as a function of time from the datasets of Ba (green squares), Br (blue asterisks), CL (purple x symbols, only in the top panel), Ka (red plus signs), ML (orange rhombuses), and Te (ciel triangles). Results are shown for individual images over the course of the first week in June 2014 (top panel) and over the course of 02 June 2014 (bottom panel). Also shown are the sunspot areas by Balmaceda et al. (2009, black squares) multiplied by ten to bring them to roughly the same level as the plage areas for the sake of comparison.
Current usage metrics show cumulative count of Article Views (full-text article views including HTML views, PDF and ePub downloads, according to the available data) and Abstracts Views on Vision4Press platform.
Data correspond to usage on the plateform after 2015. The current usage metrics is available 48-96 hours after online publication and is updated daily on week days.
Initial download of the metrics may take a while.